Maximum Drawdown Explained: The Number That Tells You What It Felt Like 2026

📉 Two Accounts, Same Return
Two accounts finished the year up 40%. You would have held one of them to the end. You would have closed the other at the worst possible moment, three weeks before it recovered.
Maximum drawdown is the number that tells you which was which. Every other statistic on a track record describes the destination. Drawdown describes the trip.
It is also the number most people read last, if at all. A big green percentage is easy to understand and easy to sell. A 34% drawdown is neither, which is precisely why it carries more information than anything above it.
🧮 What the Number Actually Measures
Maximum drawdown is the largest peak-to-trough fall your account has ever made, expressed as a percentage of the peak it fell from.
The mechanics are simple. Keep a running high-water mark. Every time the account reaches a new high, the mark moves up with it. Every time the account sits below the mark, measure the gap. The deepest gap ever recorded is the maximum drawdown:
(Peak − Trough) ÷ Peak × 100
Three consequences that get missed constantly:
It is not your worst losing trade. A drawdown is cumulative. Twelve small losses in a row, each one perfectly disciplined, can dig a hole deeper than a single catastrophic trade. The trade list can look immaculate while the curve is 30% underwater.
It is a historical maximum, not a limit. It records the worst thing that has happened so far. Nothing in the number prevents next month from being worse. On a young account, a low maximum drawdown mostly means "not enough time has passed yet".
It never goes back down. Once an account has printed a 30% drawdown, it prints 30% forever, even after a full recovery and ten new highs. That is a feature. It stops a trader from erasing the worst chapter by having a good year afterwards.
⚖️ Equity Drawdown vs Balance Drawdown
ShowMyTrades shows two drawdown figures side by side, and the distance between them is one of the most useful signals on the page.
| Metric | Measured on | Includes open positions? | What it tells you |
|---|---|---|---|
| Drawdown | Equity (balance + floating P&L) | Yes | The real fall in what the account was worth at that moment |
| DD on Balance | Closed balance only | No | The fall in realised results, ignoring anything still open |
Balance drawdown is the more flattering of the two, and it is flattering by construction: a loss that is never closed never appears in it. That is the whole mechanism behind grid, martingale and averaging-down systems. They keep the balance curve smooth by refusing to realise losers.
So when an account shows Drawdown 41% and DD on Balance 6%, nothing is broken. You are looking at a system that was 41% underwater while its closed results claimed a rough patch of 6%. The equity number is the honest one. The gap between the two is a description of the strategy.
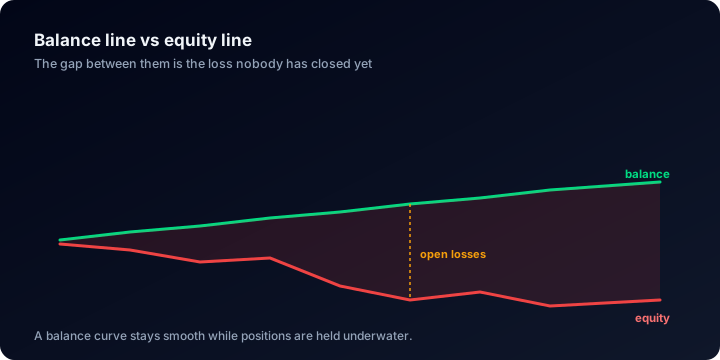
The space between the lines is a loss that already exists and simply has not been booked yet.
The reverse case is equally informative. When the two figures sit close together, positions are being closed at or near the point where the damage is taken, which is what a stop-loss is for. More on how the whole page fits together in the dashboard reading guide.
🔁 The Recovery Problem: Depth, Then Duration
Losses and gains are not symmetric, because they compound off different bases. Lose 20% of $10,000 and you have $8,000. Getting back to $10,000 means making $2,000 on a base of $8,000: a 25% gain, not a 20% one.
The gap widens fast:
| Drawdown | Gain needed to reach the old peak | Gain-to-loss ratio | Months at a compounded 5%/month |
|---|---|---|---|
| 5% | 5.3% | 1.05× | 1.1 |
| 10% | 11.1% | 1.11× | 2.2 |
| 20% | 25.0% | 1.25× | 4.6 |
| 30% | 42.9% | 1.43× | 7.3 |
| 40% | 66.7% | 1.67× | 10.5 |
| 50% | 100.0% | 2.00× | 14.2 |
| 60% | 150.0% | 2.50× | 18.8 |
| 70% | 233.3% | 3.33× | 24.7 |
| 80% | 400.0% | 5.00× | 33.0 |
| 90% | 900.0% | 10.00× | 47.2 |
Under 20% the asymmetry is a nuisance. Past 50% it becomes the dominant fact of the account: you have to double your money to arrive back where you started, using the same strategy that just halved it.
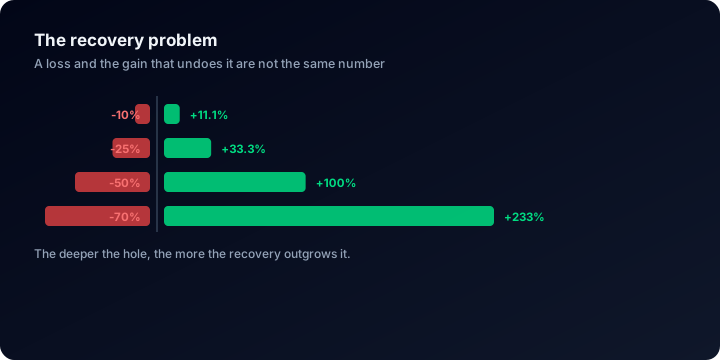
The recovery bar pulls away from the loss bar the deeper you go, and the same strategy has to deliver it.
The drawdown calculator runs this for your own balance and adds a recovery-time estimate from the monthly return you assume. Two neighbours deserve the same visit: the risk of ruin calculator and the position size calculator, which keeps single trades small enough that a losing sequence stays survivable. Full set in the forex calculators guide.
Depth is only half the question. A 25% drawdown recovered in seven weeks is a bad quarter; the same 25% still unrecovered fourteen months later is a strategy that has stopped working and has not admitted it. The depth figure is identical in both cases, and duration is what actually removes people from the market: not the fast, violent fall, where the emotion is still hope, but month nine of a flat, grinding recovery.
Duration is read off the shape of the chart rather than off a single figure. The Drawdown view in the charts module plots daily drawdown as bars over time: one wide, shallow band is harder to live through than a narrow spike of the same depth. The Growth by Trade view helps too, because it indexes the curve by trade number instead of by date and strips out the flattering effect of long idle periods.
For context on what a drawdown is built from here: the median public account on ShowMyTrades has 171 closed trades, a median average trade length of 2.4 hours and a median autotrading share of 99% (public accounts with trading history, August 2026). These are mostly fast, automated accounts. A drawdown on them is rarely one bad decision: it is a few hundred small ones pointing the same way.
📊 What Drawdown Really Looks Like on Real Accounts
This is the part no marketing page gives you. Across the public accounts on ShowMyTrades with trading history (August 2026), drawn from 10,000+ connected accounts and more than 15.4 million synchronised trades:
| Deepest drawdown reached | Share of accounts |
|---|---|
| Under 5% | 38.5% |
| Over 20% | 38.2% |
| Over 50% | 17.6% |
The median is 9.7%, and the distribution splits in a way that matters: 38.5% of accounts have never been more than 5% underwater, 38.2% have been more than 20% underwater, and only about a quarter sit between the two. Most accounts here are either genuinely conservative or genuinely not.
Then the tail. 17.6% have been more than 50% below their peak at some point. Each of those needed a 100% gain simply to get back to level.
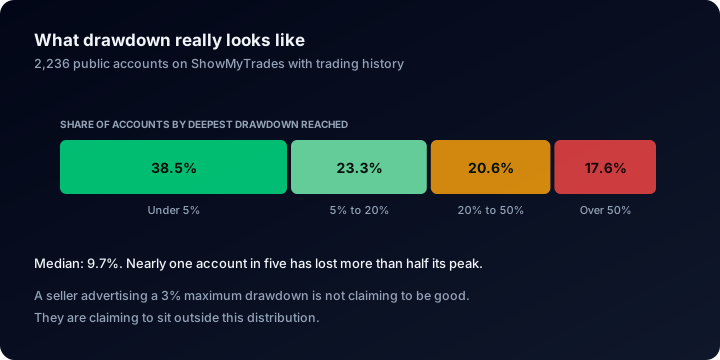
A single drawdown figure only means something once you know where it falls on this spread.
Now put drawdown next to return. On the same population the median time-weighted return is +3.2% and 63.0% of accounts are positive on a time-weighted basis. Those are two separate medians describing two different accounts, so they do not divide into a ratio, but they do set the scale. Middling returns here arrive attached to drawdowns several times their size, and a record that inverts that relationship is the one worth interrogating.
One more pairing. The median profit factor is 1.28 while the median win rate is 68.8%. Most accounts win most of their trades and still only just come out ahead, which means the losses that do arrive are far larger than the wins. That is exactly the profile that produces sudden drawdowns: a long, calm, high-win-rate stretch, then a cluster of outsized losers.
Which is why a 4% maximum drawdown advertised beside a triple-digit gain is worth pausing on. Against the distribution above it is not simply a better result; it is a claim about how the account is being measured, and the length of the history is the first thing to check. How to verify performance claims sets out the rest of the order.
🏦 How Prop Firms Count Drawdown
If you trade a funded account, drawdown stops being a diagnostic and becomes a rule. Firms differ in the details, but most enforce two separate limits.
The daily loss limit. Measured against your equity at the start of the trading day and reset at the firm's server time. It is an equity measure, so floating losses on open positions count the moment they exist. You do not have to close anything to breach it.
The total (or maximum) drawdown limit. Measured from a floor, and the floor comes in two flavours. A static floor is fixed at your starting balance. A trailing floor follows your highest equity: sometimes all the way, sometimes locking once the account is up by a set amount. A trailing floor means every profitable run raises the level at which you fail.
Two consequences follow. Because both limits are equity-based, DD on Balance is irrelevant for compliance: a system holding losers open can look calm on closed results and still breach a daily equity limit in an afternoon. And trailing floors punish giving back profit far harder than static ones, which should change how you size after a good week.
To be clear about the product: ShowMyTrades does not enforce prop-firm rules and does not alert you when you approach one. It reports the maximum equity drawdown your account has reached, which is the quantity most firms measure their total limit against. Read it as a record, not as a live rule check.
🔎 How to Read Drawdown on an Account Page
Everything below sits on a live account page, and every figure comes from the broker connection rather than from a form someone filled in.
- Stats panel.
DrawdownandDD on Balancesit on consecutive rows, directly under Gain, Abs. Gain and the two average-return rows, each with a tooltip carrying its definition. Read them as a pair, always. - Charts viewer: Drawdown. The underwater plot, as percentage bars over time. This is where duration becomes visible.
- Charts viewer: Profit Curve. Closed P&L with the drawdown drawn underneath it, so the depth lines up with the trades that caused it.
- Charts viewer: Equity Curve. Balance and equity as two lines. Persistent separation between them is floating loss, and it is the fastest way to spot a system that will not close its losers.
- Monthly returns table. Find the worst month, not the best. The worst one is the one that will happen again.
- Advanced statistics. Standard Deviation for dispersion, Sharpe Ratio for return per unit of volatility, Z-Score for whether wins and losses cluster. A strongly streaky Z-Score is the fingerprint of an averaging-down system.
- Trades table. Open the losing period and look inside it: pips, gross profit, duration, swap and commission, trade by trade.
- Explore and widgets. In the Explore activity feed, a newly published account is listed with its platform, gain, drawdown and balance inline. The embeddable widgets include a Drawdown % chart, a Profit + Drawdown chart and a stats card carrying Gain, Drawdown, Balance and Equity.
One caveat outranks all of the above: none of these numbers mean anything unless the data is broker-verified. On our own platform only 65 accounts carry Track Record Verified and 264 carry Trading Privileges Verified, so the badges are worth checking rather than assuming: see verified vs unverified track records.
⚠️ Five Ways Drawdown Gets Misread
- Reading depth without age. A 4% maximum drawdown over 60 trades is noise; the same figure over four years and 8,000 trades is evidence. Check the trade count and the start date before you react to the percentage.
- Quoting the balance figure because it is smaller. If someone advertises a drawdown and does not say which one, assume it is the flattering one and go looking for the equity number yourself.
- Treating the maximum as a ceiling. It is the worst outcome observed, not the worst possible. A strategy that has never breached 10% has only told you about the conditions it has met so far.
- Comparing drawdowns across different risk settings. The same strategy at double the lot size produces roughly double the drawdown and tells you nothing new. Compare drawdown against the return it bought, not against another account's drawdown in isolation.
- Reading a recovery as proof of robustness. An account back from 55% survived; that is all you know. The same trades in a different order would have ended it, and order is not skill.
❓ FAQ
What counts as a good maximum drawdown? There is no universal threshold, only a ratio: judge drawdown against the return it bought and the time it took to recover. As a reference point, the median deepest drawdown across our public accounts with history is 9.7%, and 38.5% of them have stayed under 5%.
Which figure should I publish, equity or balance? The equity one. It is the larger and the honest one, and anyone reading your record professionally will look for it. Publishing only the balance figure invites the assumption that you had a reason to.
Can maximum drawdown go down over time? No. It only ratchets upward. A new equity high does not reset it, and a good year does not erase it.
Does a deposit reduce my drawdown? No. Gain here is time-weighted, so funding is stripped out of it by construction. Maximum drawdown is a historical maximum: money arriving today changes the balance from today onwards, but it cannot un-record a fall that has already happened.
My account shows 8% Drawdown but 35% DD on Balance. Is that a bug? It is unusual but possible, when open profits lift equity while closed results fall. Check the Equity Curve: if the equity line runs well above the balance line, you are carrying large floating gains, and those are not results until they are closed.
How do I track drawdown on my own account? Connect it read-only and let it compute itself continuously, instead of reconstructing it from statements after the fact. The mechanics are covered in tracking your trading performance.
🔗 Related Guides
- How to read a trading account dashboard: every other metric on the page, and which ones can be gamed
- The complete guide to tracking trading performance: how to monitor drawdown continuously instead of discovering it afterwards
- How to verify trading performance claims: the checklist for a "300% gain, 4% drawdown" pitch
- How to verify your trading account: get both badges so your own drawdown figure counts as evidence
See the real distribution. The accounts on Explore are live and broker-synced, drawdowns included, the deep ones as well as the tidy ones. That is what makes a median mean something.
Connect your account free with your read-only investor password, and your own drawdown gets measured from day one instead of reconstructed later.
Time-Weighted Return Explained: Why Deposits Cannot Inflate Your Results {YEAR}
A $10,000 deposit doubles a balance without doubling any skill: how time-weighted return strips funding out, how it differs from Abs. Gain, and when to trust each.
Reading a Monthly Returns Table: What Twelve Cells Reveal About a Strategy {YEAR}
Twelve cells a year say more than the yearly total: why a row with no red month is a warning, what the empty cells mean, and how much one month can prove.