What Is Drawdown on Balance? DD on Balance
Drawdown on balance is the deepest peak-to-trough fall an account's closed balance has ever taken, ignoring the unrealised profit and loss of open positions. It counts a loss only once realised, which makes it the more forgiving of the two drawdown figures on a track record. On ShowMyTrades it is published as DD on Balance, always beside the equity-based Drawdown.
How it works
Both are worst-ever readings against the same high-water mark, drawn on balance. What differs is the value compared against it, and how often:
Peak = high-water mark of closed balance, rescaled by every cash flow

DD on Balance % = worst of (Balance − Peak) / Peak × 100              at every trade
Drawdown %      = worst of (min(Balance, Equity) − Peak) / Peak × 100  once a day
                  where Equity = Balance + floating P&L on open positions
The balance rolls forward from the account's own history, every closed trade entering net of its commission and swap. The peak ratchets upward on trading gains and never falls on its own. Both are historical worsts, not today's position, so neither ever improves.
Cash flows are handled deliberately: a deposit or withdrawal scales the peak by exactly the factor it scales the balance, so money moving in or out neither creates a drawdown nor repairs one. Both are floored at −100%, so a balance driven below zero by a stop-out reads as a total loss.
Because the two share a peak, the pair reads as one measurement:
- The two are close. Positions are closed near where they went wrong. Little is being carried.
- Equity drawdown is far larger. Losers are being held open. The account reports its losses late, and the balance figure is describing bookkeeping rather than risk.
- The two are identical. Either no floating loss ever coincided with a high-water moment, or no floating history exists for that stretch.
- Balance drawdown is the larger one. Usually the sampling gap: balance is checked at every trade, equity only on daily closing values, so a hole opened and refilled inside one day shows in the first and not the second.
Why it matters
The gap between them is the clearest single tell for a system that never closes a loser. Grid, martingale and averaging-down strategies produce a smooth balance curve by construction: a position that is never closed never touches the balance. Their equity tells a different story, and it is the equity story that ends the account.
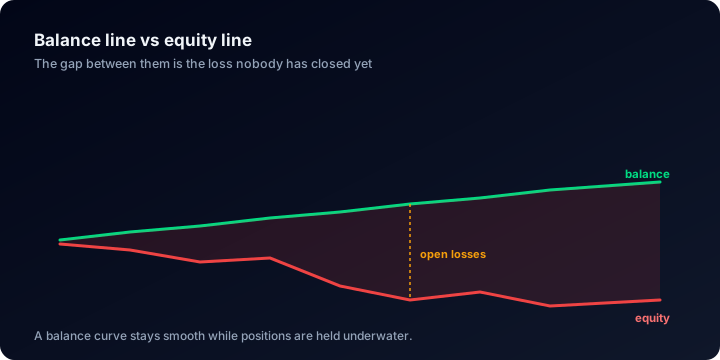
The gap between the two lines is the loss the balance figure has not been told about yet.
That is not interpretation. Margin is calculated on equity, so margin level and any margin call follow the equity line and ignore the balance line entirely. A record showing solid gains against a 3% balance drawdown next to a 45% equity drawdown is not a low-risk system: it was 45% underwater and had not admitted it. Where the two converge, that convergence is evidence in its own right: losses were taken when they occurred.
What the data shows
The figures below describe accounts published on ShowMyTrades, not traders in general. Across the published accounts with trading history (August 2026), the median deepest drawdown is 9.7%. The tails are wide: 38.5% of accounts have never been more than 5% below their peak, while 38.2% have been more than 20% underwater and 17.6% more than 50%.
That first group is where the pair earns its keep: a record under 5% is either tight risk control or a floating loss not yet realised, and the two look identical on a balance chart. Most of this population is automated: the median account runs 99% of its trades through an automated system and 53.9% are more than 90% automated. A robot holding a loser neither tires nor loses its nerve.
Where you see it on ShowMyTrades
DD on Balance sits directly under Drawdown in the Account Stats panel, on every published account page and in the Complete Dashboard widget. Those two rows are the panel's whole risk block, set off by a rule with no heading above them. The value comes from our statistics service, computed over the account's synchronised history rather than entered by anyone, and printed without its minus sign.
Two other places on the page complete the picture. The Equity row shows equity as a percentage of balance: under 100% means open positions are underwater right now, and that shortfall is exactly what DD on Balance excludes. In the charts viewer, the Drawdown view plots daily drawdown as bars over the account's life, making the duration of a decline visible rather than inferred.
Common misunderstandings
- "The lower number is the real risk." The lower number is usually DD on Balance, and it is the optimistic one by construction.
- "It excludes trading costs." It does not. Every closed trade enters the balance with its commission and swap already applied.
- "A withdrawal shows up as a drawdown." It does not. A cash movement scales the high-water mark by the same factor as the balance. Deposits cannot mend a drawdown either.
- "Both numbers see the same detail." The equity figure is sampled once a day, so a fall and full recovery inside one session leaves no trace in it.
For the full method, including why depth and duration are separate questions, see maximum drawdown explained.
Related terms
Absolute Gain
Absolute gain is net closed profit and loss divided by total deposits. Here is the formula, how it differs from Gain, and what published accounts show.
Drawdown
Drawdown is the peak-to-trough fall in an account's value, in percent. Here is the formula, why it is cumulative, and what thousands of real trading accounts show.
Margin Level
Margin level is equity divided by used margin, as a percentage. The formula, the margin call and stop out thresholds, and why it falls fastest when you lose.
Maximum Drawdown
Maximum drawdown is the deepest peak-to-trough fall an account ever recorded. The formula, the recovery table, and the real spread across thousands of accounts.