What Is Position Sizing? Formula and Lot Size Calculation
Position sizing is the decision of how large a trade to open, derived from how much of the account you are willing to lose if the trade fails. It converts a risk percentage into a lot size using two inputs: the distance to your stop and the value of one pip at that size. It is the single variable that determines an account's drawdown profile, and it is chosen before the trade rather than discovered after it.
How it works
Three steps, in order.
1. Risk amount   = Account balance × Risk %
2. Pip value     = Contract size × Pip in quote currency × FX rate to account currency
3. Position size = Risk amount / (Stop distance in pips × Pip value per lot)
A worked example on a $10,000 account risking 1% per trade, with a 50-pip stop on EUR/USD, where one standard lot moves $10 per pip:
Risk amount   = 10,000 × 0.01      = $100
Position size = 100 / (50 × 10)    = 0.20 lots
Widen the stop to 100 pips and the same $100 of risk buys 0.10 lots. The risk stays constant; the size adapts. That inversion is the whole idea, and it is why sizing and stop-loss placement cannot be decided separately.
Three methods dominate in practice:
- Fixed lot. Always 0.10 lots, whatever the stop or the balance. Simple, and the risk per trade drifts constantly as both change.
- Percentage risk (fixed fractional). The formula above. Risk stays proportional, so losses shrink in currency terms as the account falls, the mechanism that makes recovery arithmetically possible.
- Martingale progression. Size increases after a loss to recover it. Wins are frequent and small, the equity curve looks immaculate, and the distribution of outcomes has a fat left tail that arrives all at once.
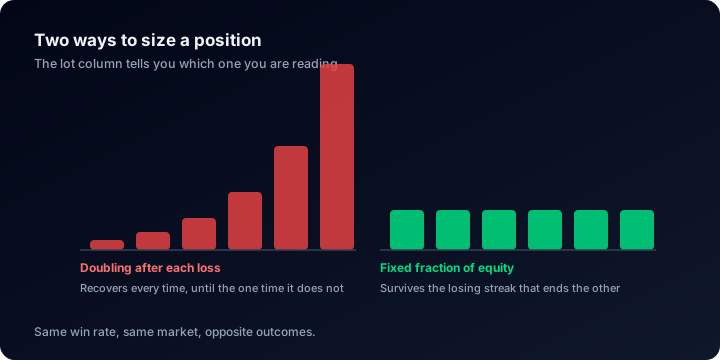
Which one an account uses is readable from the lot sizes alone.
Why it matters
Entries decide whether you win. Sizing decides whether you are still there for the next one. Two traders taking identical signals with identical stops produce identical win rates and completely different accounts, because one risked 0.5% and the other risked 8%.
Sizing is also where leverage does its actual damage. High leverage is not itself risk: it is permission to take risk. The risk arrives when that permission is used to open a size whose stop distance implies a loss the account cannot absorb twice in a row.
What the data shows
Sizing leaves its signature in the drawdown tail. Across the accounts published on ShowMyTrades that have trading history (August 2026; accounts published here, not traders in general), 38.2% have been more than 20% underwater at some point and 17.6% have lost more than half their peak value.
A properly sized fixed-fractional account rarely reaches that last band. Losing 50% at 1% risk per trade requires roughly 69 consecutive losses. Accounts in that tail generally arrived another way: escalating size after losses, or a size chosen without reference to the stop at all.
Context for who is doing the sizing: the median autotrading share on these accounts is 99%, and 53.9% run above 90% automated, against 42.2% under 10%. On more than half of the published set, position size is a line in an EA's settings, configured once and never revisited as the balance moves.
Where you see it on ShowMyTrades
The position size calculator runs the formula above with live prices, in your account currency, for percentage or fixed-amount risk and for stops expressed in price or pips.
On a published account page you can audit sizing rather than assume it. The trades table carries a Volume column showing the lot size of every individual trade, so a size that steps up after each loser is visible directly. Custom Analysis adds a Lot Size min/max filter: set a floor above the account's normal size and see whether the surviving trades cluster immediately after losses, which is the martingale signature. Total Lots in the Advanced Statistics module gives the aggregate; across published accounts it stands at 1,724,575 lots traded.
Common misunderstandings
- "Risking 2% means using 2% of my account." No. 2% is the loss if the stop is hit. The margin the position occupies is a separate figure entirely, set by leverage.
- "I risk 1% per trade, so my worst case is 1%." Only with one position open. Five correlated positions at 1% each are one 5% trade wearing a disguise, and correlated pairs move together precisely when it hurts.
- "No stop loss, so no risk to calculate." Without a stop, the position size formula has no denominator: the risk is not small, it is undefined, and its true value is the margin call.
- "Compounding means scaling up." Fixed-fractional sizing scales both ways. Increasing lots after wins while holding them constant after losses is not compounding; it is a slow ratchet toward a drawdown you never sized for.
For the full set of risk and sizing tools and when each one applies, see the forex calculators guide.
Related terms
Stop Loss
A stop loss is a pre-committed exit order that closes a losing trade at a set price. Types, why it is not a guarantee, and what thousands of real accounts show.
Drawdown
Drawdown is the peak-to-trough fall in an account's value, in percent. Here is the formula, why it is cumulative, and what thousands of real trading accounts show.
Leverage
Leverage is the ratio between position size and the capital backing it. Here is the margin formula, a worked example, and drawdown data from thousands of accounts.
Maximum Drawdown
Maximum drawdown is the deepest peak-to-trough fall an account ever recorded. The formula, the recovery table, and the real spread across thousands of accounts.