Volume Analysis: What Your Lot Sizes Say About Your Risk 2026

📏 The One Number You Actually Choose
Every other figure on a track record is an outcome. Volume is an input.
You do not decide your win rate, your drawdown or your profit factor: you find out what they were. You decide your lot size, on every trade, before the market has any say in it. That makes volume the closest thing a trading record has to a statement of intent: how much risk the trader was willing to take, whether that appetite grew with the account or with the losses, and whether the thing doing the sizing was a person or a program.
So this guide treats volume as a risk fingerprint, not a market indicator. Forget order flow and tick volume: on a broker-synced track record, volume means lots traded, nothing more. The numbers throughout come from the public accounts on ShowMyTrades that have trading history (a slice of the 10,000+ accounts connected to the platform), 1,724,575 lots between them, measured in August 2026. They describe the accounts published here, not traders in general.
🧬 Lot Size Progression Is a Fingerprint
Sort a trade list by time, read nothing but the volume column, and most systems announce themselves inside twenty rows.
| Volume pattern | Usually means | What to check next |
|---|---|---|
| Flat: every trade identical | Fixed-lot discipline, or an EA with a hardcoded lot | Whether the size ever changed as the balance did |
| Stepped: long runs, then a jump | Percent-of-equity sizing, recalculated occasionally | That the steps go up and down with equity |
| Sawtooth: doubles on losses, resets on a win | Martingale | The equity chart at each reset point |
| Ratchet: climbs while positions stay open | Grid or averaging down | The gap between balance and equity lines |
| Random: no relationship to anything | Discretionary sizing by feel | Whether the biggest trades are also the worst |
The sawtooth matters most, because it is the one that ends accounts. A martingale starting at 0.01 lots is harmless for six trades and lethal by the twelfth:
| Consecutive loss # | Lot on that trade | Cumulative volume committed | vs the first trade |
|---|---|---|---|
| 1 | 0.01 | 0.01 | 1× |
| 4 | 0.08 | 0.15 | 15× |
| 7 | 0.64 | 1.27 | 127× |
| 10 | 5.12 | 10.23 | 1,023× |
| 12 | 20.48 | 40.95 | 4,095× |
A system that wins half its trades meets a twelve-loss run roughly once every 4,096 sequences. That sounds like never until you count how many sequences a year of trading contains, and streaks cluster rather than arriving on schedule, which is exactly what the Z-Score in Advanced Statistics measures, one of the metrics walked through in the dashboard guide.
The point is not that martingale always fails. It is that a martingale account has a spotless equity curve right up to the day it does not, and the volume column was the only place the risk was ever visible.
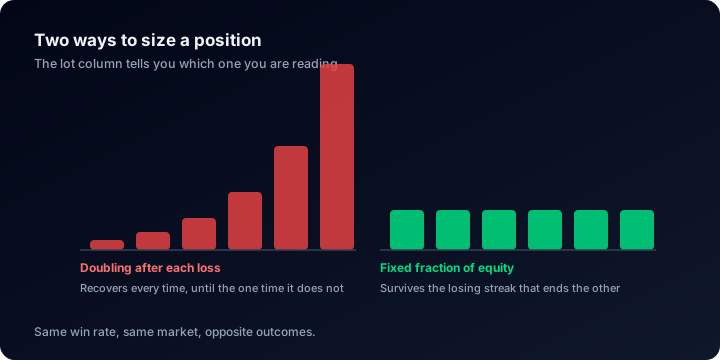
Same win rate and same market on both sides: the volume column is where the difference was declared in advance.
📉 A Constant Lot Size Means Changing Risk
Here is the trap that catches disciplined traders, not reckless ones. Fix your lot size and you have not fixed your risk: you have fixed it in currency and let it float in percentage terms, in the wrong direction, twice.
Take 0.50 lots on EUR/USD with a 30-pip stop: $150 at risk on every trade, whatever happens to the account.
| Account equity | Risk per trade | % of equity |
|---|---|---|
| $10,000 | $150 | 1.50% |
| $15,000 | $150 | 1.00% |
| $25,000 | $150 | 0.60% |
| $40,000 | $150 | 0.38% |
As the account grows, the strategy quietly de-risks itself. Compounding stops. You did the hard part: making money, and then declined to put it to work.
The other half is worse. An account down 30% with an unchanged lot size is now risking 43% more of its remaining equity per trade than it was at the peak: volume constant, risk escalating, precisely when the balance can least absorb it. The median deepest drawdown across our public accounts is 9.7%, and 38.2% have been more than 20% underwater. That is not a hypothetical stretch of the curve; it is the normal part.
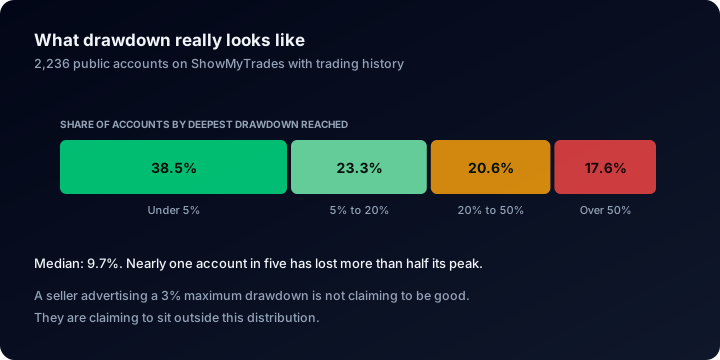
A sizing rule has to hold up in the right-hand bands, because nearly two accounts in five end up there.
⚡ Where Volume Spikes Show Up
We have not measured how often a volume spike precedes an account failure, so no percentage goes here. The arithmetic is enough on its own: a bigger lot does not predict a bigger loss, it is a bigger loss whenever the loss arrives. Two behaviours reliably produce the spike.
- Recovery sizing. A loss lands, and the next position is deliberately larger to win the money back in one trade. The biggest position of the year ends up sitting immediately after the worst day of the year.
- Averaging into a loser. The position is not closed, it is added to. Open volume ratchets up while the balance line stays flat and the equity line sinks beneath it; then the whole basket closes at once and lands as a single oversized bar.
Both leave the same signature: a tall volume bar sitting under the steepest part of the drawdown. That is why the bars live inside the equity and growth charts rather than on a separate tab: size and damage belong in the same column.
Across our public accounts, 17.6% have lost more than half their peak value at some point. The volume series under one of those collapses tells you whether it was a bad market day or a sequence of decisions that got larger as they got worse.
📊 Reading the Volume Overlay on ShowMyTrades
Every public account page carries the volume series in five places.
The chart module. Five buttons across the top: Growth, Balance, Profit, Growth by Trade, Drawdown. The Growth and Balance views draw daily volume as bars beneath the curve, on a hidden right-hand scale capped at five times the tallest bar, so volume never occupies more than the bottom fifth of the chart and never fights the equity line for attention. Hover any day and the tooltip adds Volume: 3.40 lots next to the return. The Profit view reports the same figure in its tooltip without drawing bars.
One thing to know before reading a bar: lots are grouped by the day each trade closed, not the day it opened. Intraday, the two are the same day. On a swing account they are not: a position opened in March and closed in June puts its entire volume on the June bar, so a tall bar marks the day the exposure was released, not the day it was taken.
Advanced Statistics → Total Lots. In the Trades block, between Avg. Loss and Total Commissions. It sums the volume of every closed trade. On its own it means little; divide it by Total Trades in the same panel for the average lot size, the number actually worth comparing between two records.
The Duration scatter. Advanced Statistics carries its own view switch (Table, Weekday, Hourly, Duration) and the Duration view replaces the table with one bubble per trade: hours held on the x-axis, profit on the y-axis, green for winners and red for losers, bubble size set by volume.
It is the fastest way to spot a trader whose largest positions are also the ones held longest, the signature of a losing trade being nursed. Bubble sizes are clamped at both ends, so past a point they stop growing; hover for the exact lots.
Custom Analysis. The slideover carries a Lot Size filter with Min and Max fields. Set Min to four times your usual size, apply, and the whole page (statistics, charts, monthly table, trade list) recomputes on your outsized trades alone. Visitors get the filters; from your own dashboard you can also save the set as a named preset and reapply it after each sync.
The trades table shows a Volume column per trade. Owners can switch it off under Settings → Privacy Options → Lots, and hide or recolour the chart bars under Chart Visibility and Chart Colors. Using those toggles costs you credibility with anyone doing the kind of forensic read described here: lot size is the first thing an experienced reviewer looks for.
🤖 Automation Changes What Volume Means
The median autotrading share across our public accounts is 99%. 53.9% are more than 90% automated and 42.2% are under 10%: the middle is nearly empty, and the two ends produce completely different volume series.
On an automated account the volume column is the sizing rule made visible, and it is deterministic. If it doubles after losses, that is written in the code and it will do it again. If it scales smoothly with equity, the EA has a risk model and you can infer the percentage from two rows of the trade list. On a manual account the same column is closer to a mood chart: a discretionary trader whose biggest trades cluster in one week has told you something about that week.
To isolate one robot's volume, use the magic number filter in Custom Analysis (owners can attach a readable name to each magic number, so the dropdown reads Scalper v3 - 77821 instead of a bare integer, and magic number 0 is labelled Manual), then read Total Lots from the recomputed panel. The by-magic-number table itself reports trades, profit, and wins and losses; it does not carry a lots column.
🧮 Position Sizing, Done Properly
Everything above is diagnosis. This is the fix, and it is one formula:
Lots = (Account equity × Risk %) ÷ (Stop distance in pips × Pip value per lot)
On a $25,000 account risking 1% with a 30-pip stop on EUR/USD, where a standard lot is worth $10 per pip: $250 ÷ (30 × $10) = 0.83 lots.
Three rules make it work:
- Risk a percentage, never a fixed amount. It keeps sizing honest through a winning run and a drawdown alike.
- Size from the stop, not from your confidence. A wider stop means a smaller lot. Conviction is not an input here.
- Recompute after every meaningful equity change. Not every trade, but certainly after a 10% move either way.
The Position Size Calculator does the arithmetic in your account currency, and the Risk of Ruin Calculator answers the follow-up: what happens if the losing streak runs longer than you planned for. The full calculator guide covers when each one earns its place.
One pair of numbers makes the case: across our public accounts the median win rate is 68.8%, while the median profit factor is only 1.28. Winning often is not the constraint. Losing more per loss than you win per win is, and that gap is a sizing outcome.
💸 Every Lot Has a Price Tag
Volume is not free optionality. It is a purchase, and the receipt is on the same page.
Across our public accounts, traders have paid $4,782,670 in commissions on 1,724,575 lots: roughly $2.77 per lot, blended across instruments, brokers and pricing models, including accounts that pay no commission and bury the cost in the spread. Not a rate card; the order of magnitude your edge has to clear before you keep anything.
Swap works the same way, per lot per night, and is easier to miss. Our public accounts have paid $862,547 in swap, and 86.3% of those with swap activity pay net negative swap. The median trade here lasts 2.4 hours, so most sidestep it entirely: the ones that do not pay by the lot, silently, on a chart that looks flat.
Double your lot size and you double both. If the edge per trade was thin, the larger version of a strategy can be a losing business while the smaller one worked. Track both cost lines alongside volume in your ongoing performance review.
⚠️ Five Ways Traders Misread Volume
- Confusing lot size with market volume. Nothing on a track record measures what the market did. The volume series measures what the trader did.
- Leaving the lot fixed and calling it discipline. It de-risks a winning account and over-risks a losing one. Fix the percentage, let the lot move.
- Reading Total Lots without Total Trades. 4,000 lots means one thing over 200 trades and something else over 20,000. Divide before you judge.
- Judging a spike in isolation. Check the date against the Drawdown chart and the trade list. A large position that was planned is not the same event as one that was a reaction.
- Sizing off the last result. The market has no memory of your last trade; your equity is the only thing that should move your lot size.
❓ FAQ
Does ShowMyTrades show market volume or tick volume? No. Every volume figure here is trading volume in lots: the size of positions opened on that account, delivered by the broker with the rest of the trade data.
Why doesn't Total Lots match my broker statement? Total Lots sums closed trades only. Positions still open are excluded until they close, so an account holding a large basket will read lower here than a live terminal snapshot.
How do I see how many lots a specific EA traded? Open Custom Analysis, filter by that magic number, apply, and read Total Lots in the Advanced Statistics panel. The by-magic-number table on its own shows trades, profit, and wins and losses: there is no volume column in it.
Is a high lot count a bad sign? No, it is a cost and activity statement. High volume with a short median trade length is a scalping profile, and its commissions will be large in absolute terms. What matters is the average lot relative to account size.
Should I hide the Lots column on my public page? You can, under Settings → Privacy Options. Consider what it signals: anyone comparing two records treats a hidden volume column as a missing answer, and the verification badges do not compensate for it: 65 accounts here carry Track Record Verified and 264 carry Trading Privileges Verified, and none of that says anything about how you size.
What risk percentage should I use? Most professional risk models sit between 0.5% and 2% of equity per trade. Run your own win rate through the Risk of Ruin Calculator before committing to the upper end.
🔗 Related Guides
- How to read a trading account dashboard: every metric on the page, explained
- The complete guide to tracking your trading performance: what to monitor between syncs
- How to verify trading performance claims: the forensic checklist before you pay anyone
- Forex calculators guide: which calculator answers which question
Go look at a volume series. Every account on Explore is broker-synced and public, bars and all, including the ones whose lot sizes doubled at exactly the wrong moment. Connect your account free and read your own sizing the way a stranger would.
Swap and the Carry Trade: The Cost That Bleeds While the Chart Looks Flat {YEAR}
Swap is the cost nobody screenshots: what it is, how triple Wednesday works, why 86.3% of our public accounts with swap activity pay it, and how to price a hold.
Custom Analysis: Slice Your Trade History Until It Tells the Truth {YEAR}
Filter your trade history by symbol, magic number, hour or duration, recalculate every statistic on the subset, and save the view as a reusable preset.