What Is Maximum Drawdown? Formula and Recovery Maths
Maximum drawdown is the largest peak-to-trough decline an account has recorded over its entire history, expressed as a percentage of the peak. It is the worst loss the strategy has actually inflicted, as opposed to the worst loss its owner expects. It never decreases: once printed, a 34% maximum drawdown stays at 34% through every subsequent new high.
How it works
Walk the equity curve forward one point at a time, keeping the highest value seen so far. At each point, measure the fall below that running high. The maximum drawdown is the deepest fall found anywhere on the walk.
MaxDD % = max over t of [ (Peak(0..t) − Value(t)) / Peak(0..t) ] × 100
The result depends entirely on which curve you walk, and ShowMyTrades publishes both.
| Metric | Measured on | Open positions counted? | What it tells you |
|---|---|---|---|
| Drawdown | Equity (balance + floating P&L) | Yes | The real fall in what the account was worth at that moment |
| DD on Balance | Closed balance only | No | The fall in realised results |
Balance drawdown is the more flattering figure, and it is flattering by construction: an unrealised loss is invisible to it. That is the mechanism behind grid, martingale and averaging-down systems: they keep the balance curve smooth by never closing losers.
So an account showing Drawdown 41% and DD on Balance 6% is not broken. It was 41% underwater while its closed results claimed a rough patch of 6%. The equity figure is the honest one, and the gap between the two is a description of the strategy. When the two sit close together, positions are being closed near the point where damage is taken, which is what a stop-loss is for.
Why it matters
Recovery is asymmetric, because the gain has to compound off a smaller base than the loss did.
| Maximum drawdown | Gain needed to reach the old peak |
|---|---|
| 10% | 11.1% |
| 20% | 25.0% |
| 30% | 42.9% |
| 50% | 100.0% |
| 70% | 233.3% |
| 90% | 900.0% |
Under 20% the asymmetry is a nuisance. Past 50% it becomes the dominant fact of the account: you have to double your money with the same strategy that just halved it.
Maximum drawdown is also the number that sets your practical leverage ceiling. If a system has historically drawn down 30%, running it at double position size implies a 60% drawdown you have no evidence you can sit through.
What the data shows
The numbers here come from accounts published on ShowMyTrades, not from traders at large. Across the published accounts that have trading history (August 2026), the median deepest drawdown is 9.7%, and the spread around that median is wide in both directions.
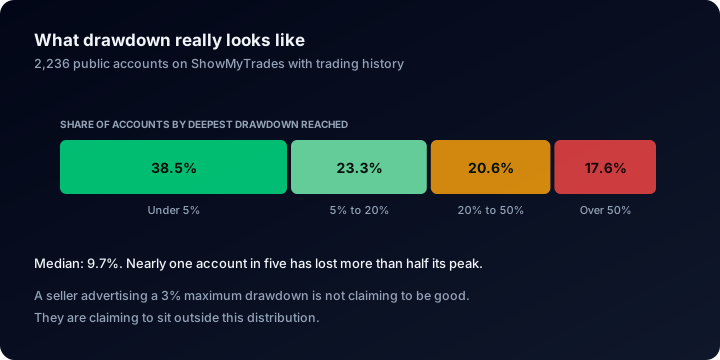
Median 9.7%, and the tail is longer than most published claims allow for.
At the far end, 17.6% have fallen more than 50% below their peak and 38.2% have been more than 20% underwater. Roughly one account in six has therefore faced the 50% row of the recovery table above: a 100% gain required just to get back to level.
The near end deserves the same scepticism: 38.5% record a maximum drawdown under 5%. Some of those are genuinely conservative. Many are simply young. The median published account holds 171 closed trades at a median trade length of 2.4 hours; on a sample that size, a small maximum drawdown records what has not happened yet rather than what cannot. A maximum drawdown is a claim about the tail of a distribution, and tails need history behind them, which is why the figure is only worth much on a verified track record.
Where you see it on ShowMyTrades
The Account Stats panel on every published account page shows Drawdown and DD on Balance on consecutive rows below Avg Monthly %, both derived from the broker feed rather than self-reported. Compare them first; the divergence is the fastest read on the page.
The charts module includes a dedicated Drawdown view, which plots daily drawdown as bars and so answers the question the headline percentage cannot: how long the account stayed below its high-water mark. A 25% drawdown recovered in seven weeks and a 25% drawdown still open fourteen months later print the identical number and are not the same account. The drawdown calculator runs the recovery table above against your own balance.
Common misunderstandings
- "My maximum drawdown improved this year." It cannot improve. It is a historical maximum, and a good year cannot un-print it.
- "The two drawdown figures should match." They match only when positions are closed near the loss. A wide gap is the signature of held losers, not a data error.
- "Small max drawdown, low risk." Not on a short history. Ask how many trades and how many months produced it before treating it as a risk measure.
- "Percentage drawdown and money drawdown are interchangeable." A 30% fall on a $2,000 account and on a $200,000 account are the same risk profile and very different experiences, but only the percentage is comparable between accounts.
For maximum drawdown in context with every other metric on a live account page, read how to read a trading account dashboard.
Related terms
Profit Factor
Profit factor is gross profit divided by gross loss. Below 1.0 an account loses by construction. Here are the bands and the 1.28 median across thousands of accounts.
Verified Track Record
A verified track record is performance data pulled straight from the broker through a read-only link, continuously, with nothing the publisher can edit.
Drawdown
Drawdown is the peak-to-trough fall in an account's value, in percent. Here is the formula, why it is cumulative, and what thousands of real trading accounts show.
Position Sizing
Position sizing turns a risk percentage into a lot size using your stop distance and pip value. The formula, the three common methods, and what bad sizing costs.