What Is Drawdown? Definition, Formula and Real Numbers
Drawdown is the decline in an account's value from a previous peak down to a subsequent low, expressed as a percentage of that peak. It measures how far the account fell from its own best point, not how much it lost on any single trade. Because it accumulates, a 20% drawdown can be built out of forty small losses just as easily as out of one disaster.
How it works
Every account carries a running high-water mark: the highest value it has ever reached. Drawdown is the distance below that mark at any given moment.
Drawdown % = (Peak value − Current value) / Peak value × 100
The mark only moves up. When a new high is printed, the high-water mark resets to it and drawdown returns to zero. Until then, every day below the peak is a day in drawdown, whether the account is falling or grinding sideways.
Three distinctions decide what the number actually means:
- Relative vs absolute. Relative drawdown is the percentage above. Absolute drawdown, as MetaTrader reports it, is the fall below the initial deposit in currency, a completely different figure that can read 0% on an account currently 40% below its peak.
- Equity vs balance. Equity drawdown counts floating losses on open positions. Balance drawdown counts only closed trades, so a loss that is never realised never appears in it.
- Current vs maximum. Current drawdown is where the account sits today. The historical worst is maximum drawdown, and it is the figure most track records quote.
Why it matters
Drawdown is the constraint that decides whether a strategy is investable, because losses and gains do not compound symmetrically. A 20% fall needs a 25% gain to get back to even. A 50% fall needs 100%.
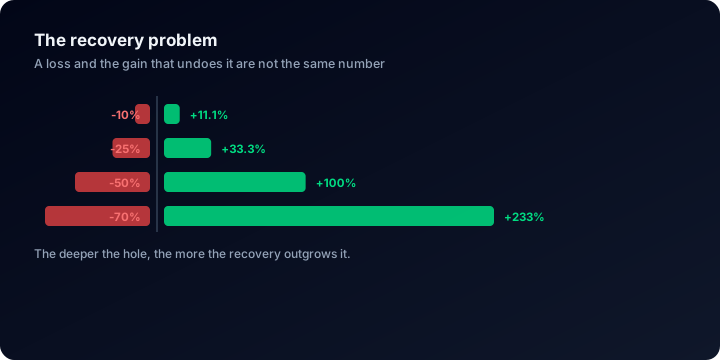
Past 50%, the recovery is a bigger job than the loss that caused it.
It is also the number that removes people from the market. Almost nobody quits during a fast, violent fall: the emotion there is hope. They quit in month nine of a flat recovery. Depth is only half of it; duration is the other half, and it is invisible on a returns chart.
And drawdown is the direct output of position sizing and stop-loss discipline, far more than of entry quality. Two traders with identical signals and different lot sizes produce identical win rates and completely different survivability.
What the data shows
The figures below describe accounts published on ShowMyTrades. They are not a survey of traders in general. Across the published accounts that have trading history (August 2026), drawn from 15,436,464 synchronised trades, the median deepest drawdown ever reached is 9.7%.
Set that against what the same accounts earned. The median time-weighted return is +3.2%, and 63.0% of them are positive over time. The middle account here therefore gave up roughly three times its eventual return in peak-to-trough decline along the way: the risk absorbed is larger than the result, and larger by a multiple rather than a margin.
That ratio, not the raw depth, is what makes a drawdown figure readable. A published claim of large gains beside a two- or three-percent drawdown is not impossible, but it sits at the outer edge of this distribution, and the rest of the account page is where an edge case has to be justified.
Where you see it on ShowMyTrades
On every published account page, the Account Stats panel carries two figures on consecutive rows, immediately below Avg Monthly %: Drawdown, measured on equity so floating losses on open positions are included, and DD on Balance, measured on closed results only. Both are historical maxima rather than today's reading, and both come from the broker feed rather than from the account owner.
The charts module has a Drawdown view that plots daily drawdown as bars over the life of the account. That is where the duration of a decline becomes readable instead of inferred, which no single headline percentage can convey. The drawdown calculator runs the recovery arithmetic on your own balance.
Common misunderstandings
- "Drawdown is my biggest losing trade." It is not. It is a cumulative peak-to-trough path that can contain hundreds of trades, including winners.
- "My drawdown went back to zero after I recovered." Current drawdown did. Maximum drawdown never falls, by design: it stops a good quarter from erasing a bad one.
- "Low drawdown means low risk." On a young account it usually means untested. The median published account here has 171 closed trades; below a few hundred, a small drawdown is a sample size, not a risk profile.
- "Balance drawdown is the real one." It is the flattering one. Grid and averaging-down systems keep balance drawdown small precisely by refusing to close losers.
For how drawdown reads alongside every other number on an account page, see how to read a trading account dashboard.
Related terms
Profit Factor
Profit factor is gross profit divided by gross loss. Below 1.0 an account loses by construction. Here are the bands and the 1.28 median across thousands of accounts.
Stop Loss
A stop loss is a pre-committed exit order that closes a losing trade at a set price. Types, why it is not a guarantee, and what thousands of real accounts show.
Maximum Drawdown
Maximum drawdown is the deepest peak-to-trough fall an account ever recorded. The formula, the recovery table, and the real spread across thousands of accounts.
Position Sizing
Position sizing turns a risk percentage into a lot size using your stop distance and pip value. The formula, the three common methods, and what bad sizing costs.