What Is Time-Weighted Return (TWR)?
Time-weighted return, or TWR, measures the return produced by trading decisions alone, with deposits and withdrawals removed. It cuts the account's history at every cash flow, measures each piece separately, and compounds the pieces together. It is the number shown as Gain on ShowMyTrades account pages.
How it works
Money moving in or out changes the balance without anyone trading. TWR handles that by never letting a cash flow enter a return calculation:
TWR = [(1 + r₁) × (1 + r₂) × … × (1 + rₙ)] − 1

rᵢ = Profit in period i / Balance at the start of period i
Each period runs between cash flows. A deposit ends one period and starts the next at the new, larger balance; it never appears in a numerator. On ShowMyTrades the sub-periods are days: each day's return is measured against the balance standing at its start, net of the costs charged inside it, and the days are compounded.
Worth stating plainly. Fund an account with $10,000 and make $2,000: the first period returned 20%. Deposit another $10,000, taking the balance to $22,000, then make $2,000 again: the second period returned 9.1%, because the base was larger. The balance shows +$4,000 on $20,000 put in. TWR shows (1 + 0.20) × (1 + 0.091) − 1 = +30.9%. The deposit itself earned nothing.
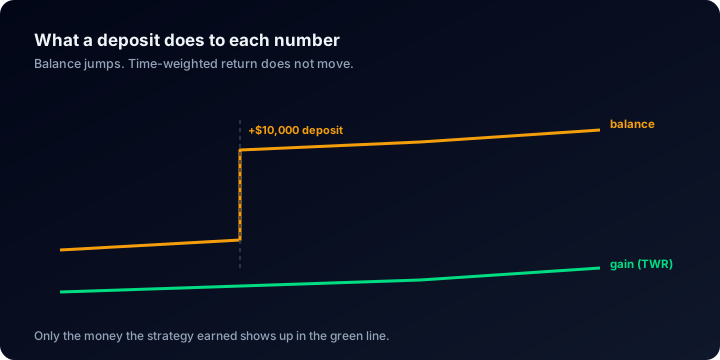
The balance jumps the day money arrives. Gain does not.
This is what separates it from Abs. Gain, the other percentage on the same panel:
Abs. Gain = Net closed P&L / Total deposits × 100
Abs. Gain answers what the account returned on the money put in; TWR answers how well the money was traded. Both are honest, but only one is comparable across accounts of different sizes and funding patterns.
Why it matters
TWR is the reason a track record can be compared at all. Without it, a percentage can be improved by depositing into a drawdown: a $5,000 loss on a $10,000 account is −50%, and a $10,000 top-up the next day makes the same unrecovered hole read as −33% of the new balance.
It cuts the other way too, which is why it is the fair number rather than the flattering one. A withdrawal does not raise TWR, and a well-timed deposit before a good month does not either. What remains is the equity curve of decisions, the only part a reader of a verified track record can hold the trader responsible for.
What the data shows
The figures below describe accounts published on ShowMyTrades, not traders in general. Across the published accounts that have trading history (August 2026), the median time-weighted return is +3.2%, and 63.0% of them are positive on a time-weighted basis.
Two readings follow. First, a majority of published accounts do make money by this measure: the distribution is not the wasteland the internet claims. Second, the middle of that distribution is small: +3.2% against a median deepest drawdown of 9.7%, so the typical account gave up about three times its eventual return along the way. The same set shows 38.2% of accounts having been more than 20% underwater at some point, and 17.6% more than 50%.
The median account here has 171 closed trades, drawn from 15,436,464 synchronised trades overall. A large TWR on a short history is a statement about a few weeks, not about a method.
Where you see it on ShowMyTrades
Gain is the first and boldest row of the Account Stats panel on every published account page, and it is TWR. Abs. Gain sits directly beneath it so the funding-sensitive figure is never far from the funding-neutral one. Avg Daily % and Avg Monthly %, the next two rows down, are derived from the same time-weighted series.
The charts viewer, one panel that switches views rather than a stack of charts, plots it two ways. Growth shows daily compounded TWR over the life of the account; Growth by Trade plots the same series against trade number instead of the calendar, which makes frequency visible: two accounts at +40% look identical on a calendar and completely different when one took 90 trades and the other 9,000. The Balance view shows the raw money, deposits and withdrawals included, which is exactly the picture TWR is designed to correct. The monthly returns table breaks the same time-weighted series into months and years.
Common misunderstandings
- "TWR is how much money I made." It is not a currency figure. An account can show +80% TWR and a small profit if it was traded at a small size for most of its life.
- "My deposit lowered my Gain." It cannot. A deposit ends one measurement period and starts another; it contributes no return in either direction. What people usually notice is that the deposit failed to raise the percentage the way the balance chart did.
- "TWR and Abs. Gain should agree." They agree only on an account with a single deposit and no withdrawals. Any divergence is information about funding, not an error.
- "It is an annual figure." It is cumulative since the account's first trade, and it is not annualised. A +3.2% over three years and a +3.2% over three months are different results.
For worked examples, including how a deposit hides a drawdown, see time-weighted return explained.
Related terms
Verified Track Record
A verified track record is performance data pulled straight from the broker through a read-only link, continuously, with nothing the publisher can edit.
Equity Curve
An equity curve plots account value over time. The gap between the balance line and the equity line is where hidden losses live. What public accounts show.
Drawdown
Drawdown is the peak-to-trough fall in an account's value, in percent. Here is the formula, why it is cumulative, and what thousands of real trading accounts show.
Expectancy
Expectancy is the average profit or loss of one trade: (win rate × avg win) − (loss rate × avg loss). The formula, a worked example, and public accounts.