How Long Before a Track Record Means Anything? 2026

⏳ The Question Everybody Asks Badly
"How long does a track record need to be?"
Right instinct, wrong question: it has no single answer. A scalper can produce 500 trades in a month. A swing trader taking ten a month needs fifty months for the same 500. Those two records are identical in size on one clock and roughly fifty times apart on the other.
There is a second problem, and it is bigger. People ask about length to find out whether the profit is real. Almost nobody asks whether the loss has happened yet. That is what a short record hides.
This guide is about sample size: how much evidence a track record carries, and where the arithmetic runs out. The numbers come from the public accounts on ShowMyTrades with trading history, drawn from 10,000+ connected accounts and 15.4 million synchronised trades, measured in August 2026. They describe accounts published here, not traders in general.
🎲 What Three Profitable Months Actually Proves
Take a strategy with no edge at all (a coin flip with a chart attached), and assume each month is an independent 50/50. The probability of a run of green months is then back-of-envelope arithmetic.
| Consecutive green months | Chance for a no-edge strategy | Expected count in a crowd of 1,000 |
|---|---|---|
| 3 | 12.5% | 125 |
| 6 | 1.6% | 16 |
| 9 | 0.20% | 2 |
| 12 | 0.024% | 0 or 1 |
Three green months eliminates seven traders out of eight. Impressive, until you read the other side: in any group of a thousand people with no skill at all, 125 have a perfect three-month record right now, and every one of them can screenshot it.
Now the uncomfortable part: that table is the optimistic case, because real strategies are not coin flips at the monthly level. The median win rate across our public accounts is 68.8%, a population tilted toward designs producing many small wins and rare large losses. A system built that way wins most months by construction, not by edge; it can carry a negative expectancy for a year and still print eleven green months out of twelve.
So the green-month count is close to worthless alone. You need to count evidence, not wins.
⏱️ Two Clocks, and You Need Both
A track record runs on two independent scales, and confusing them is where due diligence goes wrong.
Trade count measures the edge. Every closed trade is one more sample of "does this system make money on average". More trades, tighter estimate.
Calendar time measures the regimes. Markets change behaviour on their own schedule, and you cannot accelerate that by trading more often. Two years of history contains two years of market conditions whether you took ten trades or ten thousand.
The table below is an illustration, not a measurement: pick four trading speeds, hold each fixed, and divide. Nothing in the first column is a statistic about anybody's account.
| Style | Assumed trades per month | Months to reach 400 trades | Calendar covered by then |
|---|---|---|---|
| Scalping | 500 | under 1 | a few weeks |
| Intraday | 50 | 8 | most of a year |
| Swing | 10 | 40 | three years and change |
| Position / carry | 2 | 200 | longer than most careers |
A scalper with 5,000 trades in six weeks has settled the edge question and answered nothing about the regime question. A position trader with four years of history has the mirror problem: plenty of regimes, far too few trades.
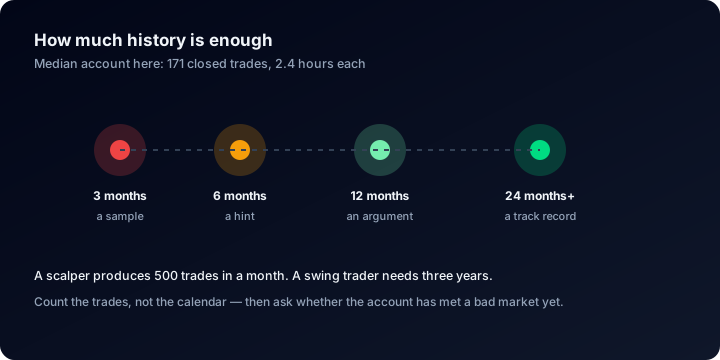
Judge a record on whichever of its two clocks is behind, because the calendar one cannot be hurried by trading more.
Our own population sits on the fast clock. The median public account has 171 closed trades and a median trade length of 2.4 hours. Trade count piles up quickly for that crowd; calendar coverage does not. So the typical account here is judged on months rather than trades.
📐 How Many Trades Before the Average Means Something
The uncertainty around an estimated average trade is the standard error: σ ÷ √N, where σ is the trade-to-trade standard deviation and N is the number of trades. Turn it around. For the measured average trade to sit two standard errors clear of zero:
N ≥ (2σ ÷ average trade)²
Plug in numbers:
| Average trade ÷ trade-to-trade standard deviation | Trades needed to sit two standard errors above zero |
|---|---|
| 0.30: exceptionally strong | 45 |
| 0.20 | 100 |
| 0.10: typical for a working retail system | 400 |
| 0.05 | 1,600 |
| 0.02 | 10,000 |
Run our median account through it. With 171 trades, √171 ≈ 13.1, so the average trade has to be at least 15% of the trade-to-trade standard deviation before the record separates itself from noise. Plenty of real systems clear that bar. Plenty do not, and a confident presentation changes nothing.
One caveat, because this is where people over-claim: it assumes trades are independent, and they often are not. Grid and averaging-down systems produce trades so correlated that a hundred carry the information of five. The Z-Score (Probability) figure in Advanced Statistics exposes that clustering: when it is strongly negative, treat the effective sample as much smaller than the trade count.
📉 Drawdown Is the Sample-Size Problem in Disguise
Maximum drawdown is a running maximum. It can rise as a record lengthens. It can stay flat. It can never fall. Once an account has been 22% underwater, it is a 22% drawdown account for good.
So on a short record, a low maximum drawdown describes the observation window, not the strategy. Two accounts running identical rules, one three months old and one three years old: the older will almost certainly show the deeper drawdown. It is not the riskier system. It is the better-measured one.
A strategy that has never met its worst market does not have a low drawdown. It has an unmeasured drawdown, and unmeasured is not a synonym for small.
The distribution across our public accounts with history:
| Deepest drawdown reached | Share of accounts |
|---|---|
| Under 5% | 38.5% |
| Over 20% | 38.2% |
| Over 50% | 17.6% |
Median: 9.7%. More than one account in six has been over 50% below its own peak at some point.
Read the top bucket honestly: that 38.5% under 5% mixes two different populations: genuinely conservative accounts, and accounts that have not run long enough to find out. The number alone cannot separate them. Only the length of the record next to it can, which is why a drawdown figure should never be read without checking the creation date first.
Before accepting anyone's drawdown as tolerable, run the recovery maths in the drawdown calculator: a 50% loss needs a 100% gain to break even. The risk of ruin calculator covers position sizing; both appear in the forex calculators guide.
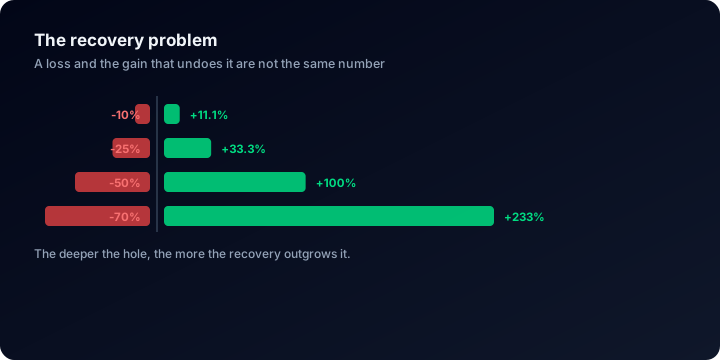
The penalty for meeting a drawdown you had not measured grows faster than the drawdown itself.
📊 What the Population Actually Looks Like
From the same accounts:
| Measure | Value |
|---|---|
| Accounts with positive time-weighted return | 63.0% |
| Median TWR | +3.2% |
| Median profit factor | 1.28 (1.29 on accounts with 100+ trades) |
| Median Sharpe ratio | 0.05 |
| Median autotrading share | 99% (53.9% of accounts over 90%, 42.2% under 10%) |
Most published accounts are green, and the typical one is barely above water. Both are true at once, and the second is the more useful fact. Notice too that demanding 100+ trades barely moves the profit factor: this population's centre is not carried by tiny samples.
One last number: these accounts have paid $4,782,670 in commissions and $862,547 in swap. Costs are the one part of a record a short history measures accurately, because they accrue on every trade and never depend on being right. On a young account, what the trader paid is better established than what they made.
🧭 Practical Minimums, Framed as Judgement
No threshold turns a sample into proof. These are the floors below which we would not form an opinion: judgement calls, not statistical guarantees.
| The decision you are making | Closed trades | Calendar history | Also required |
|---|---|---|---|
| Is there an edge at all? | 300–500, more if the average trade is small next to its spread | 6 months, continuous | Verified data, or the rest is moot |
| Is the risk survivable? | Enough to have had a genuine bad run | 12–24 months including at least one losing cluster | Equity drawdown, not balance drawdown |
| Would I put money behind it? | Both of the above | 24 months, with the strategy stable throughout | Costs disclosed, no unexplained gaps |
Five ways people get this wrong, and the rules that follow:
- The short clock governs. 8,000 trades in five weeks is a five-week record; twenty-eight months and 40 trades is a 40-trade record. Judge on the weaker clock.
- A low drawdown on a young account is not low risk. It is an unmeasured drawdown, and on a three-month record it will almost certainly grow.
- Dependent trades are not independent samples. A hundred grid trades opened against the same move are one bet cut into a hundred pieces. Check the Z-Score before trusting the trade count.
- The best stretch is not planning information. The best quarter shows what happens when everything works. The worst shows what will happen again.
- Verified beats long, and continuous beats both. Two hundred broker-synced trades outrank two thousand from a spreadsheet, and a record with a four-month hole is two short records: the gap usually sits exactly where the interesting part was. See verified vs unverified track records and the checklist for performance claims.
🖥️ Doing This on a ShowMyTrades Account Page
Account Stats → the info icon. The popover next to the heading shows the account's Created date. Open it before any percentage: it sets the denominator for everything below.
Monthly Returns. Four views: Table, Chart, Calendar and Summary. The table is a grid of years across months with a yearly total on the right: count the cells that carry a number, because a blank month is missing sample, not a flat one. The calendar drills into one month day by day, and its legend marks the empty days No Activity.
The charts. Five views of the same money: Growth, Balance, Profit, Growth by Trade and Drawdown. Growth by Trade is the two-clocks distinction made visual: its x-axis is the trade number rather than the date, so long idle stretches stop flattering the shape. Flip between it and Growth, and the difference tells you which clock the account really runs on.
Advanced Statistics. Total Trades and Avg. Trade Length are your sample-size inputs; Standard Deviation and Expectancy feed the arithmetic above. Profit Factor, Sharpe Ratio, Z-Score (Probability) and AHPR / GHPR fill in the rest.
Custom Analysis. Set a Date Range (alongside symbols, trade type, days of week, trading hours, lot size, profit range and trade duration) and every statistic recomputes on that subset. Split the history in half and run each half separately: a real edge shows up in both, while an edge present only in the first half was fitted to it.
Owners can also slice their own record by their own magic numbers and trade comments. Those labels belong to the account owner: we never guess, name or infer which software runs on an account, and we publish no per-strategy aggregates.
The verification badges. Track Record Verified means the data arrives read-only from the broker, not from a form. Trading Privileges Verified means the publisher proved they control the account. Without the first, sample size is moot: you would be doing arithmetic on unchecked numbers. How to get both badges.
The full walkthrough of an account page covers every module one at a time.
❓ FAQ
What is the shortest record you would take seriously? For a fast automated system: roughly 400 closed trades and six continuous months, verified, with the drawdown chart showing at least one real dip. For a swing system, calendar time carries the weight instead: 18 to 24 months. Both are judgement, and both assume the strategy did not change midway.
My account is three months old. How do I make it worth reading? You cannot shortcut the sample, but you can make it count. Verify it, publish it, then leave it alone: an unbroken record accruing month after month is the whole asset. Practical steps in tracking your trading performance.
Is a longer record always better? No. If the strategy changed a year ago, the older data measures a system that no longer exists, and blending the two is worse than reading the recent part alone. Use the Custom Analysis date range to isolate the current version.
Does backtest history count toward the sample? No. A backtest measures how a rule set would have performed on data it can already see. It can be re-run until it looks good, and shares almost none of the failure modes of live execution. Only forward, broker-verified trades count.
Why is the median public account only up 3.2%? Because it is a real median across live accounts of every age, including ones connected last month and ones in a drawdown. Useful as an anchor: a record showing +300% with no red months asks you to believe something far outside a distribution built from 15.4 million real trades.
🔗 Related Guides
- How to read a trading account dashboard: every metric on the page, explained
- Verified vs unverified track records: why the data source outranks the sample size
- How to verify trading performance claims: the checklist before you pay anyone
- Tracking your trading performance: building a record worth reading
Go and count some samples. Explore lists public accounts with gain and drawdown; open one and the account page gives you the creation date, the trade count and the full monthly grid.
Connect your account free and start the clock. The only version of this problem you can solve is the one that starts accumulating today.
Your Win Rate Is Lying to You: What Real Accounts Show {YEAR}
Across the public accounts the median win rate is 68.8% and the median profit factor only 1.28. The arithmetic behind that gap, and how to check your own.
How to Show Your MT4 or MT5 Trading Results on Your Website
Put the live equity curve, statistics and trades of a MetaTrader 4 or 5 account on your own site in about ten minutes: connect read-only, publish, paste one snippet. Free.