How to Audit What Your Broker Really Costs You 2026

Most traders can quote their gain to one decimal place and have no idea what the broker took to produce it.
That is not carelessness. Your terminal shows profit per trade, your statement shows a balance, and neither adds up what left the account as commission. Nothing at all shows what the spread cost, because the spread was never a line item: it was inside your fill price before the trade existed.
So the useful question is not "is my broker expensive". It is: what is this account paying per lot, and would the same strategy have kept more money somewhere else? That question has an arithmetic answer, and you already have the inputs.
💸 Three Lines Separate Gross From Net
Every cost you pay to trade is one of three things. They behave differently, they hit different strategies, and only two of them are ever written down.
| Cost | How you pay it | Where it appears | Who it hurts most |
|---|---|---|---|
| Spread | Baked into the open and close price | Nowhere as a line: only inside Pips and P&L | Scalping, small targets, high trade count |
| Commission | Charged per lot, per side or per round turn | Commission column, Total Commissions | High volume, EAs, anything that churns |
| Swap | Debited or credited when a position is held past rollover | Swap column, Total Swap Paid | Swing and carry positions held for days |
Spread is the invisible one. You never see a charge; you see a worse entry and a worse exit. The tell is a mismatch between the pip column and the money column. If Total Pips is comfortably positive while net profit is flat, the strategy found the moves and handed the proceeds to the cost of getting in and out.
Commission is the honest one. It is a real debit with a real number attached. A Commission column of pure zeros does not mean the account is free; it means the broker priced its markup into the spread instead. Zero commission is a pricing model, not a discount.
Swap is the patient one. It bills you for time rather than for activity, which is why it can drain an account that looks like it is doing nothing wrong, including the triple charge most brokers book on one night of the week to cover the weekend.
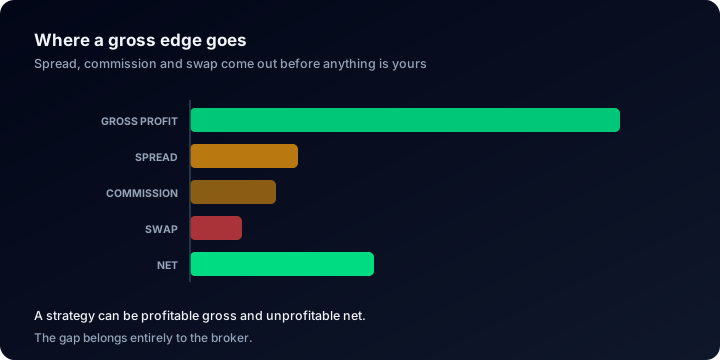
Two of those three deductions arrive as line items you can add up; the first one only ever shows as pips that never arrived.
📊 What Costs Actually Look Like at Scale
Numbers help here, and we can publish ours because the accounts are broker-synced rather than self-reported.
Across the public accounts on ShowMyTrades with trading history (measured August 2026):
- $4,782,670 paid in commissions
- $862,547 paid in swap
- 1,724,575 lots traded
In aggregate, commissions are roughly five and a half times swap. That ratio is not a law of nature: it reflects what these accounts do. The median account here closes its average trade in 2.4 hours, so most positions never reach a rollover. Shift the population towards swing trading and the two lines would converge fast.
Swap is also asymmetric. Among the accounts with any swap activity at all, 86.3% pay net negative swap: carry works against the position far more often than for it. If your plan involves being paid to hold, confirm it is actually happening on your account instead of assuming it from a table on a website.
For context, the 10,000+ connected accounts on the platform sit across 703 distinct broker servers. There is no single set of trading conditions to measure yourself against: there are hundreds, and yours is one of them.
📏 Cost Per Lot Is the Only Comparable Unit
Absolute cost totals are useless for comparison. A $9,000 commission bill is cheap on 4,000 lots and outrageous on 300. Divide by volume and the number becomes portable.
Take Total Commissions, Total Swap Paid and Total Lots straight from the Advanced Statistics block of your account page. Both cost lines are shown signed, exactly as the broker booked them, so a charge reads as a negative number: take the magnitudes:
Cost per lot = (|Total Commissions| + |Total Swap Paid|) ÷ Total Lots
If your swap total is positive, the broker paid you to hold and that line belongs on the other side of the sum.
Run that arithmetic on our public accounts and you get a rough scale reference:
| Line | Total across the public accounts | Per lot traded |
|---|---|---|
| Commissions | $4,782,670 | ≈ $2.77 |
| Swap paid | $862,547 | ≈ $0.50 |
| Both | $5,645,217 | ≈ $3.27 |
Read that as an order of magnitude, not a benchmark. A lot is not a fixed quantity of anything: one lot of gold, of an index CFD and of EURUSD are different animals, and this pool mixes all of them alongside accounts denominated in different currencies. Your own figure, computed on your own account, is the only clean one.
The number becomes intuitive once you convert it into pips. Work out what a pip is worth at your typical position size with the pip calculator, then divide. At $10 per pip for one lot, a cost of $3.27 per lot is about a third of a pip round trip. On a scalping system targeting 4 pips, that is 8% of gross gone before slippage. On a swing system targeting 200 pips, it is noise.
If your broker or introducing broker pays cashback, the rebate calculator shows what your volume claws back: rebates are quoted per lot, exactly the unit you just measured. The rest of the arithmetic is in the trading calculators guide.
🔎 Where the Costs Live on a ShowMyTrades Account Page
Cost data is not a special report here. It sits in the ordinary modules of an account page, the same ones on your dashboard and on the public version, unless the owner has switched a module off in their privacy settings.
Advanced Statistics carries Total Commissions and Total Swap Paid as running totals, next to Total Lots, Total Trades and Total Pips. Those five values are everything a per-lot audit needs, on one screen.
The trades table is where the pattern shows. Net P/L is always on, and the column picker adds Profit (Gross), Swap and Commission beside it: Net P/L is exactly gross plus swap plus commission. Switch all three on and scroll: the width of the gap between the gross column and the net one is your cost structure, trade by trade.
Custom Analysis filters the whole page by symbol, magic number and date range, and carries an Include swaps in profit calculations toggle. Run the same filtered set once with it on and once with it off: the difference is what holding overnight cost that subset. Running it symbol by symbol is how you find the one instrument whose gross-to-net gap is far wider than the rest. On your own dashboard the filters can be saved as a preset and re-run each month.
Currency Pair Stats breaks trade count, pips and profit down per symbol, long and short, with a magic number tab when your trades carry one. This is how you discover that one EA or one symbol accounts for most of the trades on the account, and therefore most of the commission.
CSV export on the trades table hands you the raw rows if you would rather do the arithmetic in a spreadsheet.
The account header names the broker, with the trade server in its tooltip. That matters when comparing: two accounts at the same brand can sit on different servers with different conditions.
For a walk through every module and metric, see how to read a trading account dashboard.
⚖️ How to Compare Two Brokers Honestly
The temptation is to compare advertised spreads. Don't: they are quoted at the calmest moment of the session and say nothing about the fills your strategy gets when it actually trades.
Compare outcomes instead. Run the same strategy on both accounts, over the same period, with the same sizing, and let the numbers land. This is less exotic than it sounds: among the thousands of traders on ShowMyTrades who own at least one account, 699 run more than one and 429 run accounts at more than one broker. Connecting both and reading them side by side is ordinary practice.
The figures below are illustrative; the method is the point, and the values come from your two account pages.
| Account A | Account B | |
|---|---|---|
| Total Lots | 120.0 | 118.5 |
| Total Commissions | $840 | $0 |
| Total Swap Paid | $210 | $395 |
| Total Pips | +1,940 | +1,510 |
| Net P/L | $1,610 | $1,180 |
| Disclosed cost per lot | $8.75 | $3.33 |
| Pips per lot | 16.2 | 12.7 |
| Net P/L per lot | $13.42 | $9.96 |
Account B looks cheaper on every visible charge and keeps less money. The difference is in the pips: same strategy, same period, 3.5 fewer pips captured per lot. That gap is the spread, and it never appeared on a statement.
This is why disclosed cost per lot cannot be the verdict on its own. Net P/L per lot is the verdict. Cost per lot tells you where the money went; pips per lot tells you what the execution cost on top.
Three rules keep the test fair:
- Same period. Different weeks mean different volatility and different spreads. A comparison across different months compares markets, not brokers.
- Comparable volume. A few dozen lots per side, minimum. Ten trades will be dominated by luck.
- Same instruments. Broker pricing is symbol-specific. Competitive on majors and punitive on gold is an extremely common shape.
🧮 Why Thin Edges Die Here
Costs matter in proportion to how much edge you have to spend. Most accounts do not have much to spare.
Across those same public accounts, the median profit factor is 1.28: $1.28 of gross profit for every $1.00 of gross loss. Sitting next to it is a median win rate of 68.8%, which sounds like a much better story. It isn't. Winning two trades in three while barely clearing a 1.28 profit factor means the average winner is small relative to the average loser, and a strategy shaped like that has very little room between gross and net.
That is the whole point of the audit. A profit factor of 1.28 can become 1.10, or 0.95, on a costlier account without one thing changing about the strategy.
Advanced Statistics prints Expectancy as both figures on one line, pips and currency: when the pip figure is healthy and the currency figure is thin, the edge is real and the costs are consuming it. That is a fixable problem (pricing model, symbol choice, holding time, volume tier) and it is an entirely different problem from a strategy that does not work.
Turning this from a one-off check into a habit is covered in the guide to tracking trading performance.
⚠️ Five Ways People Misread Broker Costs
- Treating zero commission as cheap. It relocates the cost into the spread, where you cannot audit it. Sometimes it genuinely is cheaper: you establish that with pips per lot, not with the marketing page.
- Comparing total cost instead of cost per lot. More volume costs more money. That is not a finding.
- Ignoring swap because the numbers look small. Swap is charged per night, per lot, and quietly. With 86.3% of the accounts that have swap activity paying net negative, "small" compounds in the wrong direction for months.
- Assuming a published track record's costs are yours. A public account shows what that account paid at that broker on that server. It is evidence about the strategy's cost sensitivity, not a quote for you.
- Auditing costs on unverified numbers. If the data was typed in rather than pulled from a broker, the cost lines are as editable as everything else. Verified vs unverified track records explains why that distinction ends the conversation.
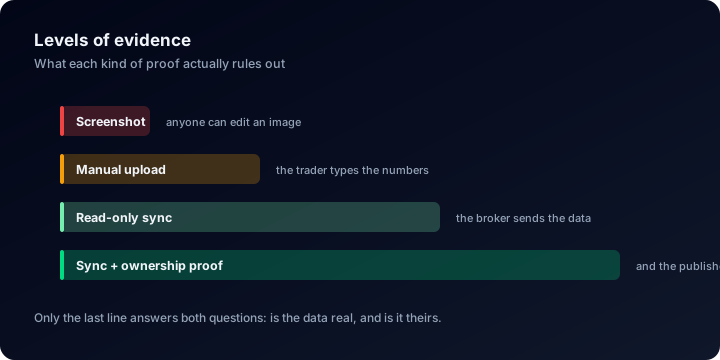
A cost line is worth exactly as much as the connection that produced it.
❓ FAQ
My Commission column is all zeros. Is my account really commission-free? The commission is genuinely zero; the total cost is not. That broker prices its markup into the spread instead. Measure it with pips per lot against a raw-spread account running the same strategy.
Why can't ShowMyTrades just show me my spread cost? Because no platform receives it. The spread is embedded in the execution price the broker reports, not delivered as a separate field. What we can do is show every disclosed cost as its own line, so whatever remains unexplained is attributable to spread and slippage.
Does the platform recalculate costs, or is it what the broker reported? It is what the broker reported. MT4 and MT5 accounts connect through our Expert Advisor or a read-only investor password, cTrader through OAuth, TradeLocker through its API. The commission and swap on your page are the values carried on the trade records themselves.
How many trades before a cost comparison means anything? Enough volume that a handful of trades cannot swing it. For reference, the median public account on ShowMyTrades has 171 closed trades. A few dozen lots per side is a reasonable floor for a broker comparison.
Is a high cost per lot always bad? No. A position-trading account paying $12 per lot on 40 lots a year hands over $480. Judge cost against gross profit, never in isolation.
🔗 Related Guides
- How to read a trading account dashboard: every metric on the page, including the ones costs interact with
- The complete guide to tracking your trading performance: turning a one-off audit into a monthly routine
- How to verify trading performance claims: the checklist before you trust anyone's numbers, cost lines included
- The forex calculators guide: pip value, rebates and position sizing, with the arithmetic explained
See the cost lines on real accounts. Every page linked from Explore is broker-synced and public, with commissions and swap on their own lines instead of folded into the gain.
Connect your account free, read your own cost per lot, and find out what you have actually been paying.
Reading a Monthly Returns Table: What Twelve Cells Reveal About a Strategy {YEAR}
Twelve cells a year say more than the yearly total: why a row with no red month is a warning, what the empty cells mean, and how much one month can prove.
Cost Percentage: How Much of Your Gross Profit the Broker Keeps {YEAR}
Commissions and swap come out of your gross profit, not out of thin air. Compute the ratio from four fields on your account page and see what the broker keeps.