Cost Percentage: How Much of Your Gross Profit the Broker Keeps 2026

You already know what you paid. It is printed on every account page: Total Commissions and Total Swap Paid, two absolute figures in your account currency.
What that does not tell you is the only thing that decides whether those costs matter: what share of your gross profit they took.
Four thousand dollars of commission is a rounding error on eighty thousand dollars of gross profit. It is fatal on forty-two hundred. Same broker, same rate card, same trader: opposite outcome. The absolute number cannot tell you which one you are living in.
The ratio can, from numbers already published on the page, and it explains why some perfectly good strategies never make money.
💸 What Cost Percentage Actually Measures
Cost Percentage is your trading costs expressed as a share of what the strategy produced before the broker took its cut.
Gross result = Net result + Commissions + Swap paid
Cost %       = (Commissions + Swap paid) / Gross result x 100
Enter both cost figures as positive amounts: you are adding back what was already deducted. Note that Total Swap Paid is displayed with its sign, red for a net payer and green for the minority who are net receivers. If yours is green it is a credit rather than a cost, and does not belong in the numerator.
Read the output as ownership. 20% means the broker keeps a fifth of what your edge produced. 50% means a silent partner who takes half and carries none of the risk. Above 100% means the strategy worked and you still lost money: gross-positive, net-negative, the most common way a competent system quietly bleeds out.
One note on the denominator. Some traders divide costs by gross winnings instead, which always produces a smaller, friendlier number. This guide uses gross result: of everything the edge produced, how much survived to your balance.
🧮 A Worked Example With Real Inputs
Every input below is a field on a ShowMyTrades account page. Start with the Advanced Statistics module.
| Field on the account page | Value |
|---|---|
| Total Trades | 1,000 |
| Total Lots | 500.00 |
| Total Commissions | −$3,500 |
| Total Swap Paid | −$400 |
Commission per lot: $3,500 / 500 lots = $7.00 round turn.
Now the result. Say the net closed P&L for the year (the Profit figure in the summary cards at the top of the page) came to +$300.
Gross result = 300 + 3,500 + 400 = $4,200
Cost %       = 3,900 / 4,200 = 92.9%
The strategy generated $4,200 of edge over a year and $3,900 of it went to the broker. The trader kept $300 and twelve months of screen time. Nothing on the page looks broken: the equity curve is green, the profit factor is above 1.0, the monthly table has more green cells than red.
Now change one thing. Suppose the same $4,200 of edge is harvested in 500 trades instead of 1,000, at the same average lot size: 250 lots instead of 500.
Costs      = (250 x $7) + $400 = $2,150
Net result = 4,200 - 2,150 = $2,050
Cost %     = 2,150 / 4,200 = 51.2%
The strategy did not improve. The entries did not get better. Take-home went from $300 to $2,050 because the same edge was paid for half as many times.
⚖️ Why a 1.28 Profit Factor Leaves No Room
Across the public accounts on ShowMyTrades with trading history (August 2026), the median profit factor is 1.28, 1.29 on accounts with more than 100 closed trades. For every dollar those accounts lost they made $1.28, so the entire margin of survival is twenty-eight cents on the dollar.
Two details make that margin thinner than it looks.
First, on ShowMyTrades the profit factor is already computed after costs. The account statistics treat a trade's result as gross P&L plus swap plus commission, and a trade only counts as a win if that net figure is positive. So 1.28 is what survived the broker, not what the strategy produced. Whatever the pre-cost number was, it was higher, and the Cost Percentage is the measure of how far it fell.
Second, the median win rate on those same accounts is 68.8%. A win rate that high sitting next to a profit factor that low means the losers are larger than the winners: the typical published account is right far more often than it is wrong, and gets paid less for being right. Reading a trading account dashboard covers why that pairing is so easy to misread.
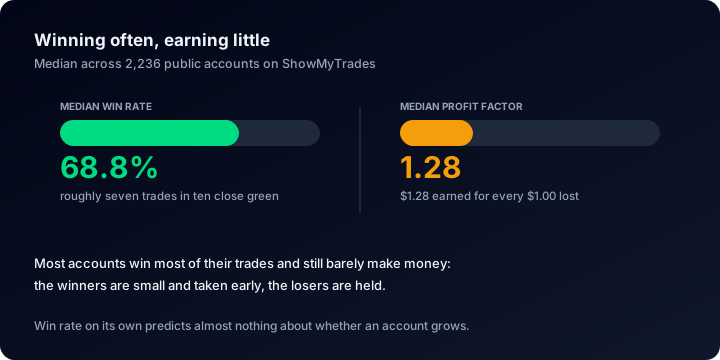
Twenty-eight cents on the dollar is the entire budget out of which commission and swap get paid.
A system with that profile has almost no tolerance for a fixed levy on every trade. Costs do not attack the losers, where there is plenty of room. They attack the winners, where there is none.
⏱️ Why the Ratio Punishes Scalpers and Spares Swing Traders
Commission scales with volume. Swap scales with volume multiplied by nights held. Neither scales with how good your edge is, which is why the same edge produces completely different net outcomes depending on how it is expressed.
The median average trade length across those public accounts is 2.4 hours, so most positions never see a rollover and commission is effectively the whole bill. Pair that with the automation profile: a median autotrading share of 99%, with 53.9% of accounts more than 90% automated, and the shape of the volume is clear: it comes largely from systems that open and close inside the same session, and every one of those round trips pays full freight whether the trade was worth taking or not.
Here are three systems with an identical $10,000 of gross edge, priced at the same $7 per lot as the worked example. The numbers are an illustration, not measured data.
| Scalper | Intraday | Swing | |
|---|---|---|---|
| Closed trades per year | 4,000 | 600 | 90 |
| Total lots | 2,000 | 300 | 45 |
| Commission at $7/lot | $14,000 | $2,100 | $315 |
| Swap paid | $120 | $300 | $1,600 |
| Gross result | $10,000 | $10,000 | $10,000 |
| Net result | −$4,120 | $7,600 | $8,085 |
| Cost % | 141% | 24% | 19% |
The scalper is not a worse trader. The edge is identical across all three. The scalper simply buys it 4,000 times instead of 90.
This is why Cost Percentage belongs in the design phase, not the post-mortem. A backtest profitable on gross prices has not been tested until the cost bill is divided by the gross result: the standard applied to every other number in tracking your trading performance.
🌙 Swap Is Small in Aggregate and Decisive in Concentration
Across the public accounts on ShowMyTrades, $862,547 has been paid in swap against $4,782,670 in commission (August 2026). Commission is more than five times larger in total, which is why swap gets left out of the calculation entirely, and why it does its damage on the minority of accounts that hold overnight.
86.3% of the accounts with any swap activity pay net negative swap. Carry is a losing proposition for the overwhelming majority of published accounts, so if you hold through rollover, assume you are paying and read the figure rather than hoping.
Swap is awkward for this arithmetic specifically. It accrues on positions that are still open, so it is not yet inside the closed-trade totals you are dividing. And it is charged for elapsed time rather than activity, which means the main lever in this guide does not touch it: halving your trade count without shortening your holds leaves the swap line where it was.
Divide both totals by the 1,724,575 lots traded on the public accounts and the blended bill is roughly $2.77 of commission and $0.50 of swap per lot, averaged across zero-commission and round-turn accounts alike. Your own rate is the one that matters.
🔎 Where the Inputs Live on a ShowMyTrades Account Page
There is no Cost Percentage field on the page, but the four numbers that produce it sit in one module.
Advanced Statistics carries Total Commissions, Total Swap Paid, Total Lots and Total Trades, both cost totals being lifetime figures over closed trades. Divide commissions by lots for your rate per lot; divide the two costs together by trade count for your cost per round trip. Then read Expectancy in the same module, shown in pips and in currency: if expectancy per trade is smaller than cost per trade, you have your answer already. The net result completing the denominator is the Profit figure in the summary cards above.
Two modules turn the single ratio into a breakdown. The trades table hides Profit (Gross), Swap and Commission by default; switch them on from the column picker and the cost structure of every trade sits beside the always-visible Net P/L.
The Custom Analysis slideover filters by symbol, magic number, hour of day, weekday, trade duration, lot size and trade comment: filter by magic number and you have isolated one EA's costs inside a multi-strategy account, which is where a single expensive strategy usually turns out to be carrying the whole ratio.
Two caveats. An owner can hide any of these modules from the public version of their page, so an account showing no cost block is not an account with no costs.
And where they are shown, the figures come from the broker connection rather than from a spreadsheet, which matters more for costs than for anything else on the page, because costs are the first line item to get quietly rounded down when someone is reporting their own numbers. How to verify trading performance claims covers the rest of that checklist.
🛠️ Four Levers That Move the Ratio
- Volume per unit of edge. The biggest lever, and the only one entirely under your control: fewer, larger positions beat more, smaller ones at identical risk. The position size calculator makes that trade-off concrete.
- Rebates. A $1.50 per lot rebate on the 500 lots in the worked example returns $750, turning $300 of take-home into $1,050 without touching the strategy. Run your own volume through the rebate calculator.
- Session and symbol selection. Spreads widen around rollover and thin out in liquid hours, so a system that habitually enters at 23:50 server time pays twice for the same entry.
- Nights you do not need. If the exit logic does not depend on the overnight session, close before rollover. Convert the swap into pips with the pip calculator and compare it to your average winner; the forex calculators guide covers the rest.
⚠️ Five Ways Cost Percentage Gets Misread
- Comparing absolute costs between accounts. $12,000 of commission is 6% against $200,000 of gross profit and 80% against $15,000. Only the ratio travels between accounts.
- Computing it on a losing account. A negative denominator returns a percentage that looks reassuringly small. When gross is negative, costs are not the problem. The strategy is.
- Double-counting. The currency statistics in Advanced Statistics (profit factor, expectancy, average win and loss) are already net of commission and swap. Subtract the costs again and you manufacture a loss that does not exist.
- Mixing denominators. A ratio computed on gross winnings is always smaller than one computed on gross result. Both are defensible; comparing one against the other is not.
- Judging it on a short history. The median account in the public set has 171 closed trades. Below a few hundred, one outlier winner can halve the apparent ratio and one quiet month can double it.
❓ FAQ
What counts as a good Cost Percentage? These bands are a working convention rather than a measured threshold. Under 20% is comfortable; 20–40% is workable if the edge is strong; above 50% the broker is the main beneficiary of your strategy. Above 100% is the one hard line, because it is arithmetic rather than judgement: you are gross-positive and net-negative, and volume is the first thing to cut.
Is Cost Percentage shown on the account page? Not as a field. You compute it from Total Commissions, Total Swap Paid and the net result, all of which are published on a public account page unless the owner has hidden the module.
Does this include the spread? No, and that is the caveat that matters. Spread is not reported as a separate line by any of the platforms; it is baked into the entry and exit price, so it already sits inside gross P&L rather than alongside commission and swap. A Cost Percentage computed this way is a floor, not a ceiling, and the gap between floor and reality widens the more you trade.
My Total Commissions is $0. Is my trading free? It means your broker prices in the spread instead of billing separately. The cost is real, just invisible in that field, which is why zero-commission and raw-spread accounts are only comparable on total cost per lot rather than line by line.
My Cost Percentage is over 100%. What do I change first? Volume, not risk. Halving the number of round trips used to harvest the same edge is the fastest fix, followed by a rebate on the volume you cannot avoid. Raising lot size to outrun the costs deepens the drawdown without moving the ratio at all. And a bad ratio does not automatically mean a bad broker: more often it means your trading frequency and your rate card are mismatched.
🔗 Related Guides
- How to read a trading account dashboard: every metric on the page, in order
- Tracking your trading performance: which numbers deserve monitoring, and how often
- How to verify trading performance claims: before you trust anyone else's cost figures
- The forex calculators guide: position size, pips, rebates and the rest
Go and look at the ratio somewhere real. Open any account on Explore showing its Advanced Statistics module and the four inputs are right there, including on the accounts where the answer is uncomfortable.
Then connect your own account free and find out what your edge is worth once the broker has been paid.
How to Audit What Your Broker Really Costs You {YEAR}
Spread, commission and swap decide whether a profitable strategy pays you. Here is how to measure each one per lot, and compare two brokers on the same strategy.
Swap and the Carry Trade: The Cost That Bleeds While the Chart Looks Flat {YEAR}
Swap is the cost nobody screenshots: what it is, how triple Wednesday works, why 86.3% of our public accounts with swap activity pay it, and how to price a hold.