What Is a Track Record in Trading?
A track record is the documented history of a trading account: every closed trade, the equity path those trades produced, and the periods in between. It records what happened; it is not a claim about what will. This entry covers what a record must contain and how long it has to run before it means anything. Whether the data can be trusted at all is answered by a verified track record.
How it works
A record that carries evidence is trade-level, not summary-level. The minimum contents:
- Every closed trade, with open and close time, instrument, direction, volume, both prices and the result.
- The cost of each trade: commission and swap kept separate from gross profit, because a summary that nets them together hides where the money went.
- The equity path, so the order of results is visible. A profit factor reads the same whether the losses came first or last; the curve does not.
- The gaps. Months without trading are information, as are deposits and withdrawals, which change what a percentage means.
- The cost that cannot be shown, acknowledged: the spread sits inside every fill price and appears in no field.
Length runs on two independent clocks, and they do not convert into each other.
Trade count    -> how much evidence there is about the edge
Calendar time  -> how many market conditions the edge has met
A high-frequency system can print 500 trades in a month and still have seen one month of one market. A swing trader reaching 500 trades has lived through years. Read both clocks; the shorter one governs.
Why it matters
A track record can prove a strategy loses money long before it can prove one makes money. Profits accumulate slowly and are easily produced by luck; the failure mode arrives all at once.
This is why maximum drawdown is the figure that ages worst. It can only grow. A record showing 4% is not a record of a low-risk strategy but of a strategy whose worst day has not happened yet, and every additional month can only enlarge that number or leave it alone.
What the data shows
Across the published accounts on ShowMyTrades with trading history (drawn from 10,000+ connected accounts and 15,436,464 synchronised trades), the median account has 171 closed trades and a median trade length of 2.4 hours. These figures describe accounts published here, not traders in general.
Read those together. At 2.4 hours per position, 171 trades is not years of history; for an active system it can be weeks of calendar time. The median public record is thin on both clocks at once, which is the normal condition of a track record rather than an unusual one.
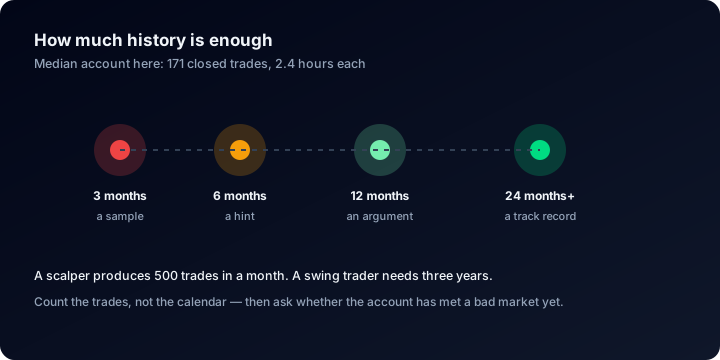
Count the trades, not the calendar, and let the shorter clock govern.
The consequence shows in the risk figures. Median deepest drawdown is 9.7%, yet 38.2% of accounts have been more than 20% below their peak and 17.6% more than 50%. Median time-weighted return is +3.2%, with 63.0% positive. Those tails belong to the longer records; short ones have not had the chance to produce them.
One pair is worth reading side by side: median win rate 68.8%, median profit factor 1.28. Most published accounts win most of their trades and still clear almost nothing: what a record measures and a headline never does.
Where you see it on ShowMyTrades
The account page is the track record. The trade clock sits in the Advanced Statistics module as Total Trades, beside Avg. Trade Length; multiply the two and you have the time the account actually spent holding positions. The calendar clock is read from the Monthly Returns table, which shows the record month by month with empty cells left empty, so a pause in trading stays visible instead of being averaged away; its Calendar view drills into a single month day by day.
The information icon beside Account Stats shows Created and Public views. Created is the date the account was connected to ShowMyTrades, not the date its trading began: imported broker history routinely starts years earlier, so take the span from the monthly table rather than from that date.
Trade-level detail sits in the Trade History & Balance Progression table, one row per position, with Net P/L always shown and Profit (Gross), Swap and Commission available as separate columns from the Display menu. The charts panel switches between Growth, Balance, Profit, Growth by Trade and Drawdown; Growth by Trade replaces the calendar clock with the trade clock on the same data. Owners can hide individual modules from the public view.
Common misunderstandings
- "It has been running two years, so it is a long record." Two years of nine trades is nine samples. Check the trade count before the start date.
- "A track record proves the strategy works." It documents an outcome. Whether that outcome is edge or luck is a sample-size question, and most records are too short to answer it.
- "Published means verified." They are different properties. A record can be complete, detailed and entirely fabricated; provenance is what the certification badges address.
- "The drawdown figure is settled." It is a running maximum. It never falls, and on a young account it mostly describes what has not happened yet.
For the arithmetic of sample size and the minimums worth applying: how long before a track record means anything.
Related terms
Profit Factor
Profit factor is gross profit divided by gross loss. Below 1.0 an account loses by construction. Here are the bands and the 1.28 median across thousands of accounts.
Verified Track Record
A verified track record is performance data pulled straight from the broker through a read-only link, continuously, with nothing the publisher can edit.
Cost Percentage
Cost percentage is the share of gross trading result taken by commission and swap. Here is the formula, why spread is missing, and what real accounts pay.
Maximum Drawdown
Maximum drawdown is the deepest peak-to-trough fall an account ever recorded. The formula, the recovery table, and the real spread across thousands of accounts.