Your Win Rate Is Lying to You: What Real Accounts Show 2026

You win most of your trades. The account is barely up. You have probably blamed discipline, or the broker, or the market.
It is arithmetic.
Across the public accounts on ShowMyTrades that have trading history, the median win rate is 68.8%. The median profit factor is 1.28. Read those two numbers together and they describe an account that wins roughly seven trades in ten and keeps almost nothing.
This guide is that gap: why a high win rate and a flat equity curve are not a contradiction, what the payoff ratio has to be for a win rate to mean anything, and where on an account page to check your own.
🎯 Two Numbers That Cannot Both Be Good News
A 68.8% win rate sounds like mastery. A 1.28 profit factor is a business that clears 28 cents for every dollar it loses.
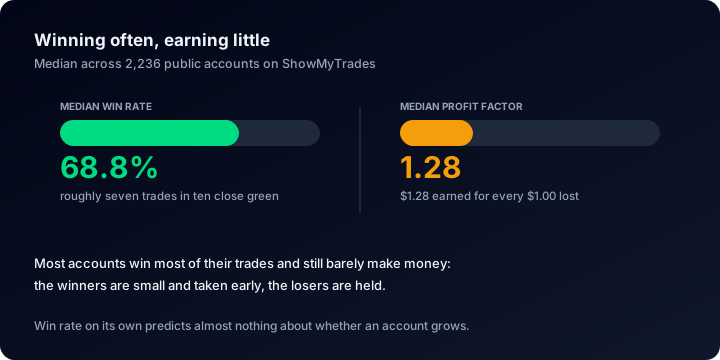
Both figures come from the same pool of accounts, and only the one on the right decides whether it grows.
One honest caveat. These are two medians of the same pool, not two facts about one trader: the account at the median win rate need not be the one at the median profit factor. They describe the shape of what gets published on ShowMyTrades, consistently. Median time-weighted return: +3.2%. Median Sharpe: 0.05. Median deepest drawdown: 9.7%. And 63.0% of these accounts are positive time-weighted, not a pool of disasters, a pool of near-misses.
High win rate. Near-zero risk-adjusted return. That combination has one explanation, and it is not bad luck.
➗ The Arithmetic Nobody Runs
Profit factor is the sum of what the winners made divided by the sum of what the losers cost. One detail before the algebra: on ShowMyTrades every currency figure in Advanced Statistics (both sums behind Profit Factor, plus Avg. Win, Avg. Loss and Expectancy) is a trade's P&L plus swap plus commission, and a trade counts as a win only if that net figure clears zero. The broker's cut is already inside all of it.
Now expand both halves:
- Total won = number of wins × average win
- Total lost = number of losses × average loss
Which means:
Profit factor = (wins ÷ losses) × (average win ÷ average loss)
Two independent terms. The first is your win rate as odds. The second is your payoff ratio: what a typical winner is worth against a typical loser. Neither is an edge alone. The product is.
Run our medians through it. A 68.8% win rate is 2.21 wins per loss. For the profit factor to land at 1.28, the payoff ratio has to be:
1.28 ÷ 2.21 = 0.58
The average winner is worth about 58% of the average loser. Put the other way: the typical loss is roughly 1.7 times the typical win.
Not a psychology story yet, a structural one. Most published accounts win far more often than they lose, and give it back on the trades they lose.
Expectancy makes the damage concrete. Our tooltip defines it as (Win Rate × Avg Win) − (Loss Rate × Avg Loss). With a 68.8% win rate and a 0.58 payoff, the average trade returns about 8.7% of one average loss. For every $100 a typical losing trade costs, a typical trade brings back $8.70: already net, so that is what reaches the balance.
📋 The Break-Even Win Rate Table
Before judging a win rate you need to know what it has to beat. Break-even win rate is 1 ÷ (1 + reward-to-risk); anything below the middle column is a losing system, no matter how good it feels.
| Reward-to-risk (avg win ÷ avg loss) | Win rate needed just to break even | Profit factor a 68.8% win rate would produce |
|---|---|---|
| 0.25 : 1 | 80.0% | 0.55 |
| 0.5 : 1 | 66.7% | 1.10 |
| 0.75 : 1 | 57.1% | 1.65 |
| 1 : 1 | 50.0% | 2.21 |
| 1.5 : 1 | 40.0% | 3.31 |
| 2 : 1 | 33.3% | 4.41 |
| 3 : 1 | 25.0% | 6.62 |
Read the right-hand column slowly. A 68.8% win rate is genuinely excellent, if the payoff ratio is respectable. At 1:1 it produces a profit factor of 2.21, a serious strategy; at 2:1, an extraordinary one.
The pool we measure sits at 1.28, putting the implied payoff just under 0.6, between the second and third rows. Run it back through the break-even formula: 1 ÷ (1 + 0.58) = 63.3%. That is the win rate the median published account needs just to stand still. It wins 68.8%. Five and a half percentage points is the entire business.
Two more things this table settles. The 40%-win-rate trend follower everyone dismisses sits exactly on break-even at 1.5:1 and produces a profit factor of 1.33 at 2:1. And a 90% win rate becomes a losing system whenever the payoff drops under roughly 0.11: the trade you make every time you widen a stop to avoid being wrong.
One caveat on which numbers you feed the formula. Take Avg. Win and Avg. Loss in currency and the answer is honest, because those are net of commission and swap. Take them in pips (the other half of the same line) and you get the pre-cost answer, which is always the flattering one.
🪞 Why the Payoff Ends Up Upside Down
Nobody sets out to build a system where losses are 1.7 times wins. It assembles itself, one reasonable decision at a time.
A trade goes green: closing it converts an uncertain gain into a certain one, and certainty feels like risk management. A trade goes red: closing it converts a paper loss into a permanent one, so you wait, and waiting occasionally works, which is what makes the habit durable. Behavioural finance calls the asymmetry the disposition effect: realise gains early, hold losses late.
The result is mechanical. Winners get truncated toward the small end of their distribution; losers keep their full tail. The win rate rises (a loss not yet closed is not yet a loss), and the payoff ratio quietly inverts.
Two supporting numbers from the same measurement. Median trade length across our public accounts is 2.4 hours, and of the accounts with any swap activity, 86.3% pay net negative swap: positions carried through the rollover, costing money in silence.
And it is not only a human failing. The median autotrading share on our public accounts is 99%, with 53.9% running above 90% automated against 42.2% below 10%. Code does the same thing when it is written that way: a tight take-profit with a distant or absent stop produces a beautiful win rate and this exact payoff shape, at machine speed.
(We never guess which commercial robot runs on an account, and publish nothing per-EA. The automation share identifies nothing: it is only the share of trades carrying a magic number, or a bot label on cTrader, and what those mean is known to the owner alone.)
💸 The Costs Are Already Inside These Numbers
An edge worth 8.7% of an average loss is thin, and the reflex is to add "and then the broker takes its cut". On ShowMyTrades that subtraction has already happened: 1.28 is what survived commission and swap, not what the strategies produced before paying them. Which cuts both ways: the pool is not as weak as a pre-cost comparison suggests, and the pre-cost figure a backtest or a vendor quotes was meaningfully higher on exactly the same trades.
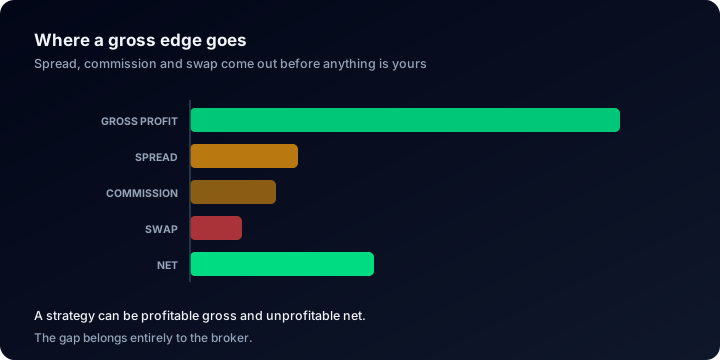
Every statistic on a ShowMyTrades page is measured at the right-hand end of this bar; a tearsheet usually quotes the left.
The page keeps both sides visible anyway: Total Commissions and Total Swap Paid sit in the Trades column as absolute amounts. Across the accounts we host they reach $4,782,670 and $862,547; public accounts alone have traded 1,724,575 lots, out of 15,436,464 trades synchronised in total. Different denominators, so do not divide one into the other: read them as evidence that at this scale the levy decides outcomes.
One free diagnostic falls out. Expectancy is printed twice on one line: pips and currency. Pips are pure price movement, costs invisible; currency is net. A positive pip figure beside a negative currency figure is a strategy that reads the market correctly and hands the result to the broker.
🔍 How to Check This on Your Own Account
All of it is readable on any ShowMyTrades account page in under a minute. No spreadsheet.
| What to read | Where it sits | The test |
|---|---|---|
| Win Rate | Advanced Statistics → Trades | Never read it alone |
| Avg. Win and Avg. Loss | Advanced Statistics → Trades (pips and currency) | Divide the currency figures: that is your net payoff ratio |
| Profit Factor | Advanced Statistics → Performance Metrics | Below 1.0 is losing by construction |
| Expectancy | Advanced Statistics → Performance Metrics | Shown in pips and currency. Must be positive in currency |
| Avg. Trade Length | Advanced Statistics → Trades | Compare with how long you think you hold |
| Total Commissions / Total Swap Paid | Advanced Statistics → Trades | What the payoff ratio has already absorbed |
Then the view that makes the disposition effect visible: the Duration toggle draws Trade Duration vs Profitability: one point per closed trade, duration horizontal, net P&L vertical, bubble size by volume. If your red points sit systematically right of your green ones, you hold losers longer than winners, and you have the receipt.
To isolate it, open Custom Analysis. Filter by Trade Duration (seconds), Symbols, Lot Size, Profit Range, Trading Hours, Days of Week or Magic Numbers (your own labels, on your own account) and every statistic recalculates on the filtered set. Compare trades under an hour against trades held over a day: the two profiles are rarely the same strategy.
Two calculators close the loop: the Risk of Ruin Calculator turns win rate, average win, average loss and risk per trade into a probability of losing your capital; the Position Size Calculator keeps the average loss where you planned it. Full set: our calculators guide.
For the rest of the page (gain versus absolute gain, equity versus balance drawdown, Z-Score, AHPR and GHPR) see how to read a trading account dashboard.
⚠️ Five Ways This Number Gets Misused
- Quoting a win rate with no payoff ratio. "85% win rate" is not a performance claim, it is one term of a two-term product. Ask for Avg Win, Avg Loss and Profit Factor, or treat it as decoration, the same reflex covered in verifying performance claims.
- Raising the win rate deliberately. Widening a stop, removing it, or averaging down does lift the percentage. It also pushes the loss into the tail and into open positions, surfacing as a gap between equity and balance drawdown rather than a red month.
- Comparing win rates across incompatible strategies. A scalper at 75% and a swing trader at 45% are not ranked by that number. Reward-to-risk decides who is ahead.
- Judging on too few trades. Median history on our public accounts is 171 closed trades, and a win rate measured over thirty of them is noise dressed as a statistic. The payoff ratio needs even more history, because a single outsized loser moves the average loss and nothing else moves with it.
- Comparing a post-cost profit factor with a pre-cost one. Ours is net: commission and swap sit inside both sums, and a flat trade that paid $7 in commission is recorded as a loss. A backtest or a vendor's tearsheet usually quotes the pre-cost version. The two do not belong side by side.
❓ FAQ
Is a high win rate ever a real edge? Yes, when the payoff ratio supports it. A 68.8% win rate at 1:1 produces a profit factor of 2.21, a strong strategy. The problem was never the win rate, but a win rate bought by paying more on losers than you take on winners.
What profit factor should I actually look for? The account page colour-codes it: red below 1.0, amber from 1.0 to 2.0, green at 2.0 and above. Our pool's median is 1.28 (amber) and 1.29 on accounts with 100 or more closed trades, so the number barely moves once the sample is real. Above 3.0 on a long history, open the trade list: it is often a handful of enormous winners that will not repeat.
My win rate fell after I started using stop losses. Did I get worse? Almost certainly the opposite: the win rate is supposed to fall when you cap the loss side. Judge the change on Expectancy and Profit Factor, not on the percentage.
Why is my Sharpe ratio so low when I win most of my trades? Because Sharpe measures return against volatility, and a rare oversized loss is volatility. Median Sharpe across our public accounts is 0.05: small wins punctuated by large losses is the classic shape behind a high win rate and a near-zero Sharpe.
Can I see Avg Win and Avg Loss on someone else's account? Yes, whenever the owner has published it: Advanced Statistics is part of the public page, with the same fields you see on your own. Whether the data behind it came from the broker is a separate question: see verified vs unverified track records.
Does any of this change for automated accounts? Not one term. The arithmetic is identical for an EA and a discretionary trader; a robot simply applies the same lopsided payoff more consistently.
🔗 Related Guides
- How to read a trading account dashboard: every metric on the page
- Tracking your trading performance: what to monitor over time
- How to verify trading performance claims: the checklist before you pay anyone
- How to verify your trading account: broker-sourced data on your own record
Go and check. Explore lists what people have just published: platform, gain, drawdown and balance on each card. One click into any account puts Win Rate, Avg. Win, Avg. Loss, Expectancy and Profit Factor on one screen, because any one of them is meaningless without the others.
Connect your account free (MT4, MT5, cTrader or TradeLocker) and your own payoff ratio stops being a guess.
How to Spot Fake EA Results Before You Buy {YEAR}
EA sales pages show backtests, not track records. Learn to read the gap: curve fitting, tick quality, lot progression, account resets, and a ten-minute buyer check.
How Long Before a Track Record Means Anything? {YEAR}
Three green months is not a track record. The arithmetic of sample size, why maximum drawdown can only grow, and the minimums to apply before believing a curve.