Same Strategy, Two Brokers, Different Results: How to Run the Comparison 2026

You are running the same strategy on two accounts. Same logic, same settings, same symbols. One curve climbs and the other crawls, and you want to know whether the broker is the reason.
The usual method is to look at both balances, decide which broker feels worse, and move the money. Then the new account underperforms too, and the cycle repeats.
The alternative is a controlled experiment: two accounts in parallel, the same filters on both, and the difference broken into parts you can attribute one at a time. This guide is about that method. It will not tell you which broker to use; nothing will, including your equity curve. It tells you where the money went.
🧩 What Actually Changes When the Broker Changes
The strategy is identical. The environment is not. Five variables move, and only two of them are ever written down.
| What changes | Where it lands | How visible |
|---|---|---|
| Spread | Entry and exit prices, so fewer pips per trade | Invisible as a line item, buried inside gross profit |
| Commission | Charged per lot at open and close | Explicit column on the trades table |
| Swap | Debited or credited per night held | Explicit column, easy to ignore |
| Execution and slippage | Fill worse than the price requested | Invisible, shows up as missing pips |
| Symbol specs and server time | Contract sizes, session boundaries, daily candle close | Changes which trades even trigger |
Two of those five are printed on your trades table. Three are not, which is exactly why the difference gets pinned on the wrong thing. A strategy losing 0.4 pips per trade to spread and slippage never sees a spread charge anywhere; it just quietly makes less money.
There is a sixth variable people forget: the server. The 10,000+ accounts connected to ShowMyTrades sit across 703 distinct broker servers, and a large broker routinely runs several. Two accounts at the same brand can be on different servers under different conditions. The broker badge on an account page carries the trade server name in its tooltip: check it before assuming the two sides are comparable.
🧪 Designing a Comparison You Can Trust
A controlled comparison is mostly about removing excuses in advance. Six decisions, all made before the first trade:
- Parallel, never sequential. March and April are different markets. If account A traded one and account B the other, you measured volatility and called it a broker.
- Both live, or both demo. Demo fills are optimistic in precisely the conditions where live fills hurt, one reason broker-synced records beat self-reported ones. A live-versus-demo test is not a test.
- Same symbols, same sessions. If one broker offers an instrument the other does not, exclude it from both sides rather than letting it contaminate the totals.
- Size relative to equity, not in fixed lots. The same lot size on two different balances is two different risks, and risk moves the result harder than costs do.
- Fix the sample in advance. Decide the number of trades before you look at the result, so you cannot stop the moment the answer flatters your preferred broker. For scale: the median public account on ShowMyTrades has 171 closed trades across its entire history.
- Write the question down first. "Which broker is cheaper per lot for this strategy" is answerable. "Which broker is better" is not.
Running two accounts at once is ordinary rather than exotic: 699 ShowMyTrades users run more than one account and 429 run accounts at more than one broker. Very few turn the setup into a measurement.
🧮 Splitting the Gap Into Parts
Say account A finished the quarter ahead of account B. That difference is a sum of six things, and the exercise is separating them until the last one is small enough to ignore.
| Part of the gap | How you measure it | How you neutralise it |
|---|---|---|
| Sizing | Lots per trade against equity on each side | Risk as a percentage, not fixed lots |
| Sample noise | Whether removing the best and worst trade flips the conclusion | More trades, same window |
| Disclosed cost | Total Commissions and Total Swap Paid over Total Lots | Nothing to neutralise: this one you simply read |
| Price quality | Average pips per trade, same symbol, same window | Isolate one symbol at a time |
| Infrastructure | Ping and retransmission on each terminal | Fix hosting before blaming pricing |
| Instrument specs | Contract size, symbol availability, server time zone | Exclude non-matching symbols from both sides |
Work down the list in order. Each row you rule out makes the next one legible, and whatever is left unattributed at the bottom is your honest residual.
The disclosed cost row is the easy one, because it is already summed for you. Total Commissions, Total Swap Paid and Total Lots sit in the Advanced Statistics block of each account page, so cost per lot is one division. It is not a small line: across the public accounts on ShowMyTrades those two rows add up to $4,782,670 in commissions and $862,547 in swap over 1,724,575 lots.
Swap deserves a second look, because it is the variable that differs most between brokers on an identical position: each broker sets it rather than the market. Among ShowMyTrades accounts with any swap activity, 86.3% pay net negative swap. If your strategy holds overnight, run the same subset twice with the Include swaps in profit calculations toggle on and off: the difference is the financing part of the gap, which has nothing to do with execution.
🎯 Pips Per Trade: Where Spread and Slippage Hide
Disclosed costs are the ones you can add up. Spread and fill quality are never charged as a fee: they are already inside the price you got, so they surface only as pips that failed to arrive.
Advanced Statistics prints a single Expectancy line carrying both figures side by side: average pips per trade and average currency per trade. The pip half is the one to compare across brokers, being size- and currency-agnostic. Read it on the same symbol over the same window:
- Account A: +2.1 pips per trade
- Account B: +1.4 pips per trade
The 0.7-pip gap is not skill and it is not the market, because both accounts traded the same signals at the same time. It is spread plus slippage. On 90 lots of EURUSD in a USD account, where a pip is worth about $10 per lot, that gap is roughly $630 which never appeared as a charge anywhere. The pip calculator converts it for your own symbol and size, and the rest of the arithmetic lives in the trading calculators.
Two cautions. A pip on gold is not a pip on EURUSD, so this is only valid symbol by symbol. And it needs a real sample: with a median trade length of 2.4 hours across ShowMyTrades public accounts, most systems here reach a usable one within a couple of months, but a slow swing system will need far longer.
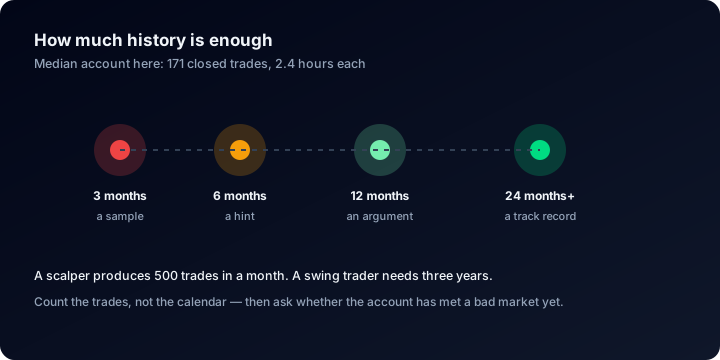
Count the trades on both accounts before you let the gap between them mean anything.
🖥️ Execution Evidence: What the Terminal Reports
Cost explains one part of the gap. Latency explains another, and it is the part most often pinned on the wrong party.
On MT4 and MT5 accounts connected through our Expert Advisor, the Terminal Info module on your dashboard account page reports what the terminal itself sends:
- Ping: round-trip time between the terminal and your broker's trade server. Under 50 ms is excellent; above 200 ms can mean slower order execution and more slippage.
- Retransmission: the share of network packets that had to be sent again. Close to 0% is a stable connection; consistently higher points to an unreliable network or a distant trade server.
- Terminal build and Memory: the actual environment the strategy runs in.
- Auto trading: Allowed or Blocked: when blocked, the Expert Advisor keeps running but cannot open, modify or close positions.
- DLL imports: whether the terminal permits external libraries.
- Connection: Connected, No trade server or Offline, with the time of the last update.
That splits one vague complaint into three diagnoses. A 220 ms ping with visible retransmission on one account against 18 ms on the other is a hosting problem, and the fix is a closer VPS, not a new broker. Identical ping on both sides with a pip gap between them is a pricing and execution problem. An auto-trading flag reading Blocked explains missing trades outright, with no broker involved.
Four limits, stated plainly. The module is owner-only: it lives on your dashboard, never on a public page. It needs the Expert Advisor connection, so an account synced with an investor password alone has no terminal reporting anything. cTrader and TradeLocker are pure REST integrations with no terminal, so there the comparison rests on costs and pips. And MT4 never sends the list of open charts, so that table is MT5 only.
One boundary that does not move. Whatever your terminal reports about the software running on it stays private. We never infer, estimate or publish which commercial Expert Advisor runs on an account, and there are no per-EA pages or aggregates anywhere on the platform. Magic numbers, labels and trade comments belong to the account owner.
🧰 Running It Inside ShowMyTrades
Connect both accounts separately. MT4 and MT5 connect through our Expert Advisor or with a read-only investor password, cTrader through OAuth, TradeLocker with email, password and server. Each header then shows the platform, the broker with its trade server in the tooltip, the currency, the leverage and a trading-mode badge such as 99% autotrading, 99% being the median autotrading share here, with 53.9% of accounts over 90% automated.
Compare that badge first: if one side is fully automated and the other largely manual, you are not running the same strategy and the rest is void.
Keep them as two pages, not one portfolio. Portfolios exist and 182 are in use, but a portfolio merges accounts into one curve, the opposite of what a comparison needs.
Build one Custom Analysis preset and apply it to both. The panel filters by date range, symbols, magic numbers (listed with your own labels), trade type, days of the week, trading hours, lot range, profit range and duration range, plus the include-swaps toggle. Save it on account A, then set the identical filters on account B. Same window, same symbols, same subset: that is your control.
Turn on the cost columns in the trades table. Net P/L is always shown; the column picker adds Profit (Gross), Swap, Commission, Pips, Duration and Magic Number. Gross and net are deliberately kept apart, because the distance between them is the answer you came for.
Then read four blocks in this order: Advanced Statistics for lots, commissions, swap and Expectancy; the currency pair breakdown, to confirm the difference is not concentrated in one symbol; Terminal Info for latency; and the monthly returns table, to check the gap is persistent rather than one bad week.
Publish if the answer is worth sharing. Verification is per account (65 accounts here hold Track Record Verified and 264 hold Trading Privileges Verified), and a comparison published on verified accounts is one a reader can check. How to get both badges.
⚠️ Where This Comparison Goes Wrong
- Running the accounts one after the other. The most common error and the most fatal. Different months are different markets, and the test never recovers.
- Changing the strategy mid-test. One parameter tweak on one side and every number after it belongs to a different experiment. Freeze both configurations, or restart.
- Letting an unmatched symbol in. An instrument available at only one broker, or with a different contract size, quietly carries the whole difference. Exclude it from both sides in Custom Analysis.
- Blaming the broker for your own hosting. A 200 ms ping with visible retransmission may be your VPS location rather than the broker's pricing. Terminal Info tells you which, and moving a server is cheaper than moving capital.
- Concluding from a handful of trades. With a median of 171 closed trades per public account here, a 40-trade sample is noise, as is any comparison decided by one outlier winner.
❓ FAQ
How long should I run both accounts before deciding? Long enough that one trade cannot flip the answer. A practical test: recompute the comparison after removing the single best and single worst trade on each side. If the conclusion changes, the sample is too small, whatever the calendar says.
Do the two accounts need the same balance? No, but they need the same risk logic. Size as a percentage of equity rather than in fixed lots, otherwise you are comparing position sizing and not brokers. The position size calculator keeps both sides consistent.
My strategy is discretionary, not an EA. Does this still work? Partly. You cannot guarantee identical entries by hand, so the sizing and sample rows stay noisy. What survives is cost per lot, valid regardless of what triggered the trades, and pip expectancy on any symbol traded on both sides in the same sessions.
Can I compare a cTrader or TradeLocker account against an MT5 one? Yes for costs, pips and results, which are computed the same way from real fills on every platform. No for Terminal Info, which exists only for MetaTrader accounts running our Expert Advisor.
Will ShowMyTrades tell me which broker is better? No, and it should not. We show what your accounts cost and how they executed. "Better" depends on your holding period, your symbols and your size. The numbers inform that decision; they do not make it.
🔗 Related Guides
- How to read a trading account dashboard: every module this comparison uses
- Verified vs unverified track records: why broker-synced data is the only comparable kind
- How to verify your trading account: getting both badges on the accounts you publish
- The forex calculators guide: the per-lot and per-pip arithmetic behind the numbers above
See what real cost lines look like. Every account linked from Explore is broker-synced and public, commissions and swap included.
Connect both of your accounts free and run the comparison on your own numbers.
Cent Accounts: Why the Numbers Look Enormous and What They Really Mean {YEAR}
A cent account shows 10,000 when the trader deposited $100. How the denomination works, why lot sizes scale with it, and which metrics it cannot distort.
How to Spot Fake EA Results Before You Buy {YEAR}
EA sales pages show backtests, not track records. Learn to read the gap: curve fitting, tick quality, lot progression, account resets, and a ten-minute buyer check.