How to Spot Fake EA Results Before You Buy 2026

🤖 You Are Not Buying a Backtest
An Expert Advisor sales page usually shows three things: a strategy tester report, a growth chart, and a price. None of the three is a track record.
The question is narrower than "is this a scam". It is: will this robot behave on a live account, at my broker, the way the page says it does? Most EAs fail it without the seller lying once: the numbers were produced under conditions you cannot reproduce.
This guide covers what is specific to EA marketing: backtests that could not have happened, parameters tuned to a past that will not repeat, lot progressions hidden under a smooth line, and the winning account that was one of twelve. For signals and managed accounts, read how to verify trading performance claims.
Every baseline below comes from the ShowMyTrades database in August 2026: 10,000+ connected accounts and 15.4 million synchronised trades, with every median measured on the public accounts that have trading history. They describe accounts published here, not traders in general, but they are real and broker-synced, enough to tell you when a claim sits outside the distribution.
📉 Backtest Versus Live: The Gap Is the Product
A backtest is a hypothesis. A live account is evidence. The distance between them is the most informative thing about any EA, and what sales pages work hardest to blur.
Three dates settle most of it: when this version of the EA was released, when the live account started trading, and when the backtest period ends. Only live trading after that release tells you anything. Everything earlier is a strategy fitted to history it already knew.
Then check both runs are the same experiment: same symbol, timeframe, set file, currency, broker type. Vendors routinely show a backtest on one symbol and a live account trading four.
| What the vendor shows | What to ask for | What settles it |
|---|---|---|
| Strategy tester report | A live, broker-connected account, same set file | Live trading that began after the version on sale |
| A terminal screenshot | A public URL with continuous synced history | Screenshots are images, not records |
| A "verified results" link | Whether the feed is read-only from the broker | The difference between verified and unverified |
| Six weeks of live results | Twelve months, worst month included | A drawdown cycle the strategy has survived |
🎛️ Curve Fitting: When the Settings Already Know the Answer
Give an optimiser twenty inputs and five years of history and it will find a combination that made money. That is not a discovery, it is arithmetic: the result describes the past perfectly and predicts nothing.
The tells are practical:
- Too many inputs. A robust idea survives with four or five parameters. Twenty is a search, not a strategy.
- Oddly specific values. Take profit at 37 pips, stop at 113, filter at 62.5. Round-ish numbers come from reasoning; these come from a grid search.
- A test window ending where the optimisation ended. The report is a scoreboard of a game already played.
- Fragility. Ask for the same backtest on a different year, and with each parameter shifted ten per cent. A robust system degrades. A fitted one collapses.
If the seller cannot say which period found the settings and which was left untouched, there was no out-of-sample test.
🧪 The Tick Problem: What "99% Modelling Quality" Really Means
The modelling quality figure in the MT4 strategy tester describes how the tester generated ticks between bars, interpolating from smaller timeframes. It does not tell you those ticks resemble what your broker printed. A 99% report built on poor history is 99% precise about the wrong prices.
Look instead at what a default backtest quietly assumes: fixed spread, no commission, no swap, no slippage, no requotes, no partial fills, no widening around news, instant execution. Every one moves in your favour and against reality.
Costs are not a rounding error. Across public accounts here, traders have paid $4,782,670 in commissions and $862,547 in swap on 1,724,575 lots, and of the accounts carrying swap at all, 86.3% pay net negative swap: the financing runs against them, month after month. A scalper backtested at zero commission and the same scalper at your broker's commission are two different products, and only one is profitable.
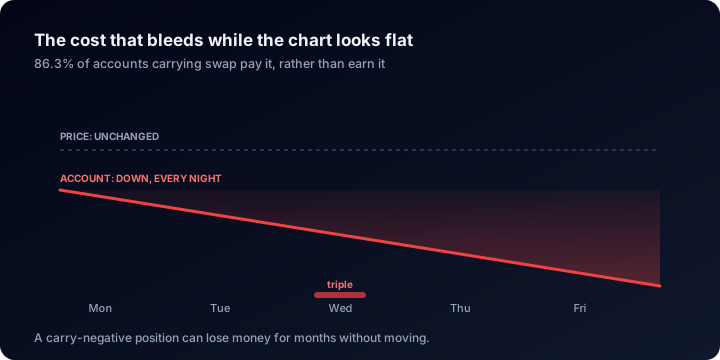
A default backtest sets this line to zero, and it is charged whether the position turns out right or wrong.
MT5 on real broker tick history is a genuine improvement, but it is still one broker's history and still cannot model your fill. Treat any fixed-spread, zero-cost backtest as a marketing asset, and price the difference yourself with the trading calculators and the guide to using them.
🎰 The Martingale Signature Is in the Lot Sizes
Reading equity curves for martingale is the slow method. Reading lot sizes is the fast one.
Filter the account to a single symbol in Custom Analysis, then read down the Lots column of the trades table: 0.01, 0.02, 0.04, 0.08, each position opened while the previous one is still underwater. That is averaging down, whatever the page calls it: "smart recovery", "grid balancing", "adaptive exposure".
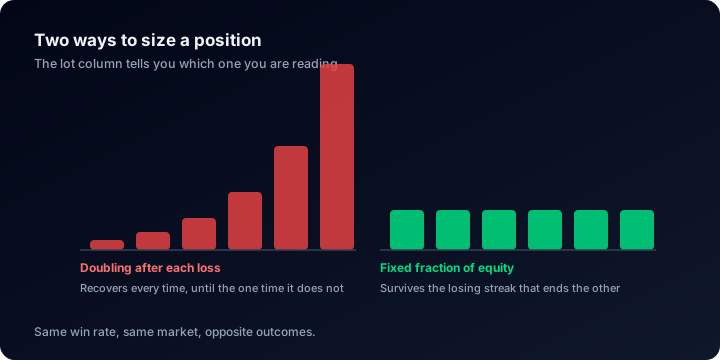
Same win rate, same market: what separates the two accounts is the column you can read in under a minute.
Four confirmations, all readable in minutes:
- Equity against balance. The Balance chart draws both lines together. A persistent gap means losers are held, not closed.
- Drawdown against DD on Balance. Both sit in the Account Stats panel. When the first is far larger than the second, the losses live in open positions.
- Z-Score. The platform reads it as a randomness measure: near zero means wins and losses arrive at random, far from zero in either direction means they arrive in streaks. Grids produce long loss streaks before they unwind.
- Open Trades tab. Dozens of simultaneous positions on one symbol, all red, is a grid mid-cycle.
Now compare the vendor's risk claim with reality. Across the public accounts:
| Deepest drawdown reached | Share of accounts |
|---|---|
| Under 5% | 38.5% |
| Over 20% | 38.2% |
| Over 50% | 17.6% |
Median drawdown: 9.7%. Nearly one public account in five has been more than half underwater, and these accounts are heavily automated: the median autotrading share is 99%, and 53.9% of accounts run above 90% automation. Robots are not safer than humans. They are faster.
Read that top row carefully: 38.5% of these accounts have never been more than 5% down, so a small drawdown on its own proves nothing. What is rare is a small drawdown attached to a large return. An EA advertising 200% a year at 5% maximum drawdown claims a corner of this distribution that is close to empty. That can be true. It needs evidence.
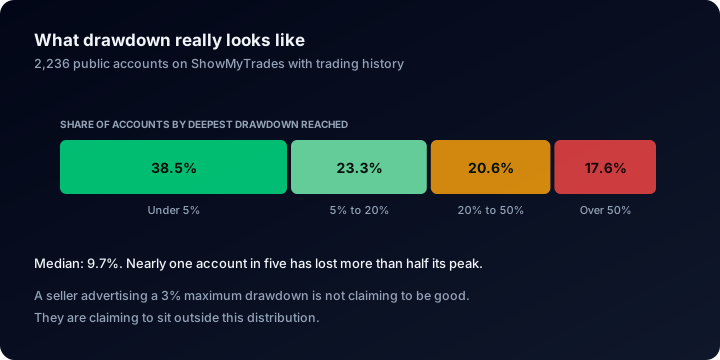
Print this shape before reading any sales page: it is the population the vendor is asking you to believe they sit outside of.
🎭 Demo, Cents, Resets and the Best Account Out of Twelve
Four costume changes turn ordinary results into a sales page. None of them requires inventing a single number.
Demo dressed as live. Demo fills are generous exactly where live fills hurt: at the open, during news, on the stop that gaps. A flawless demo curve simulates an edge, it does not prove one. On ShowMyTrades an account is labelled Real Account or Demo Account from what the broker reports (the trade mode on the account plus the server it connects to), so the label is not the publisher's to choose. On a vendor's own site, it is.
Cent accounts. Profits denominated in cents look a hundred times larger than they are. Check the currency and balance in the header, not the headline.
The reset. A record that restarts every few months is a series of attempts with the failures deleted. The tells: account age against claimed history, gaps in the monthly returns table, a drawdown smaller than the strategy's own worst month.
The best account out of twelve. Run the same EA on twelve accounts with slightly different settings and publish the one that worked: every number is genuine and the presentation is still a lie. Selection is the commonest form of EA dishonesty because it requires no fabrication.
Ask for every account running the robot, including the ones that stopped. Here, a trader's public profile lists all their published accounts and portfolios, each account page links to that trader's other accounts, and a portfolio merges several accounts into one curve with the drawdowns intact.
One boundary shapes what any honest platform can tell you: we never estimate or name which EA runs on an account, and we never build pages or rankings per robot. Magic numbers and their labels belong to the account owner, who can name their own strategies and publish that breakdown if they choose. Which puts the burden where it belongs: the vendor shows you their account, or you have nothing.
One question cuts through all four: show me the account that was running during your worst month. A seller with nothing to hide answers with a link.
📐 What Normal Looks Like Before You Believe Exceptional
You cannot judge a claim without a baseline. Here is ours, across the public accounts with history.
| Metric | Median | How to use it |
|---|---|---|
| Time-weighted return | +3.2% (63.0% positive) | Two profitable quarters is a sample, not an edge |
| Deepest drawdown | 9.7% | Read every gain claim next to its drawdown |
| Profit factor | 1.28 (1.29 with 100+ trades) | Barely moves once you demand 100+ trades: treat several times this median as a question |
| Win rate | 68.8% | High win rates are ordinary and prove nothing alone |
| Sharpe ratio | 0.05 | Smooth returns are rarer than sales pages suggest |
| Closed trades | 171 per account | Below roughly 100, statistics are decoration |
| Trade length | 2.4 hours | Check it matches the strategy described |
These accounts are self-selected (people publish what they are willing to show), so if anything the numbers flatter reality. And the strongest signals are rare: of 10,000+ connected accounts, 65 carry Track Record Verified and 264 carry Trading Privileges Verified. Both take a deliberate act by the owner, which is why they are worth asking for.
🛠️ The Ten-Minute Check on a ShowMyTrades Page
If the seller publishes an account here, everything above is a few clicks. Where each piece lives:
| Where to look | What it answers |
|---|---|
| Account header | Real Account or Demo Account, the Track Record and Trading Privileges badges, platform, broker (server name in its tooltip), currency, leverage, and the autotrading or manual-trading share |
| Account Stats | Gain, Abs. Gain, Avg Daily % and Avg Monthly %; Drawdown and DD on Balance; Balance, Equity, Highest $, Profit, Deposits, Withdrawals, with the creation date behind the info icon |
| Charts | Growth, Balance, Profit, Growth by Trade, Drawdown. The Balance view draws equity and balance together, where held losers show up |
| Monthly Returns | Red months, gaps, and the worst month rather than the best |
| Advanced Statistics | Profit Factor, Sharpe, Z-Score, Expectancy, AHPR against GHPR, Total Lots, Total Commissions, Total Swap Paid, Avg. Trade Length, plus weekday, hourly and duration breakdowns |
| Currency pair breakdown | Concentration per symbol, with a magic-number tab when the owner has published their own labels |
| Trades table | Ticket, symbol, lots, S/L, T/P, pips, gross profit, duration, swap, commission, magic number and comment, across separate Open Trades and Closed Trades tabs |
| Custom Analysis | Filter by date range, symbol, magic number, direction, day of week, trading hour, lot size, profit range, duration and comment: every statistic recomputes on the subset |
Owners can hide lots, comments, stop levels, notes and even the open or closed trade lists. That is legitimate, and also information: notice what a seller hid. Every module is explained in how to read a trading account dashboard.
Then run this in order, and stop at the first hard fail.
- Live or demo? Read the account type badge in the header. Demo means stop.
- How old? Compare the creation date with the claimed history.
- Both drawdowns. Read Drawdown next to DD on Balance. A wide gap means open losers.
- Monthly table. No red months over a long history, or unexplained gaps, means the losses sit elsewhere.
- Advanced stats. A profit factor several times the 1.28 median, or an average loss far larger than the average win, needs justifying.
- Costs. Compare Total Commissions and Total Swap Paid with Profit, and size any live test of your own with the position size calculator.
- Lot progression. Filter to one symbol in Custom Analysis and read the Lots column for doubling volumes.
- Open Trades. Count them. Many, all losing, on one pair, is a grid mid-cycle.
- Recent window. Set a ninety-day date range in Custom Analysis. Does the edge survive?
- Other accounts. Open the trader's other published accounts, then ask for the unpublished ones.
If a seller cannot supply a live, broker-synced account URL after ten minutes of asking, you already have your answer.
❓ FAQ
Is a backtest completely worthless? No. It is useful for rejecting ideas, not confirming them. A strategy that fails a clean backtest is dead; one that passes has earned a forward test.
The vendor's account has a verification badge. Am I safe? Safer, not safe. Verification says the data is real and the publisher controls the account. It says nothing about whether the strategy survives the next market regime, or whether this is the one account out of twelve. See verified vs unverified and, for what the term is worth in practice, what a verified track record proves.
What if the EA uses martingale and says so? A disclosed risk beats a hidden one. Assume the worst historical sequence repeats while you hold it, and model that with the drawdown calculator first.
Can I test an EA myself before buying? Run it on demo for the mechanics, then live at the smallest size your broker allows for the fills. Demo answers "does it execute"; only live money answers "does it execute at my prices".
I sell an EA. How do I prove my results? Connect the live account, publish it, earn both badges: the steps are in how to verify your trading account. A public page answers every objection here before a buyer raises it.
🔗 Related Guides
- The ultimate guide to verifying trading performance claims: the forensic playbook for signals and managed accounts
- How to read a trading account dashboard: every metric on an account page, explained
- Verified vs unverified track records: what a badge does and does not prove
- How to verify your trading account: get both badges on your own account
- Tracking your trading performance: what to record once the robot is live
Check a vendor the honest way. Every account on Explore is live, broker-synced and public, drawdowns included. Selling an EA? Connect your account free and let the results answer for you.
Same Strategy, Two Brokers, Different Results: How to Run the Comparison {YEAR}
One strategy, two brokers, two different curves. How to run the accounts in parallel and split the gap into sizing, cost, price quality and execution latency.
Your Win Rate Is Lying to You: What Real Accounts Show {YEAR}
Across the public accounts the median win rate is 68.8% and the median profit factor only 1.28. The arithmetic behind that gap, and how to check your own.