Running Several Accounts: Portfolio Tracking Without Fooling Yourself 2026

🧾 Four Green Numbers Are Not a Return
You run four accounts. Two MT5 accounts at the same broker running the same EA, one MT4 you trade by hand, one cTrader account you opened for the spreads. Your dashboard shows four percentages. Three of them are green.
So what did you make this year, and what did you risk to make it?
Neither number is on that screen. Those four percentages cannot be added, cannot be averaged, and cannot be compared until they sit on the same clock and the same denominator.
Multi-account is the normal case here, not an edge case: 699 of our traders run more than one account, and 429 of them run accounts at more than one broker (measured August 2026). Yet only 182 portfolios exist across the platform. Almost everyone with several accounts is still reading them one at a time.
There are three popular ways to combine accounts, and all three are wrong.
Adding the balances. Balance is funding, not performance. Deposit $10,000 into the quiet MT4 account and your combined balance jumps without a single trade being placed. Any metric built on summed balances rewards you for moving your own money around.
Averaging the percentages. A +40% on a $500 account and a −5% on a $50,000 account do not average to +17.5%. They average to roughly −4.6% of the money you actually had at risk. Unweighted averages are a machine for making small accounts look important.
Quoting the best one. This is survivorship bias applied to yourself. If you would not accept it from a signal seller, do not accept it from your own dashboard.
The only honest combination rebuilds one equity curve from every trade and every day across every account, then computes the metrics on it as if the whole thing had always been one account. That is what a portfolio does on ShowMyTrades.
🧮 What the Portfolio Actually Merges
Worth knowing precisely, because these rules explain most of the surprises.
| Input | How the portfolio treats it |
|---|---|
| Closed trades | Every trade from every selected account merged into one stream, sorted by close time |
| Daily equity | Balance and equity summed day by day; if an account reported nothing on a given day, its last known value is carried forward |
| Gain (TWR) | Recomputed on the merged curve, not an average of the component returns |
| Drawdown | Recomputed on the merged curve, against a peak adjusted for deposits and withdrawals |
| Broker | The broker's name when all accounts share one, otherwise Mixed |
| Currency | Same rule: one currency, or Mixed |
| Leverage | Average across the accounts, rounded |
| Balance, equity, profit | Summed exactly as the brokers report them |
Two consequences are worth pinning down.
Internal transfers cost you nothing. Gain is time-weighted, so deposits and withdrawals cannot move it, and the drawdown peak is adjusted for the same flows. Move $5,000 from one of your accounts to another and it registers as a withdrawal on one and a deposit on the other. The combined return does not budge. That is why time-weighted return is the number to compare.
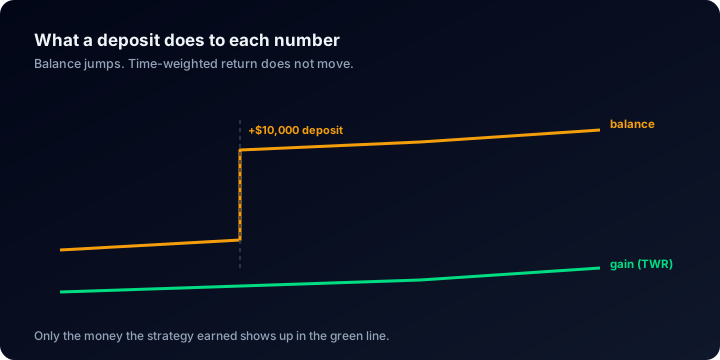
Money you move between your own accounts cannot flatter a portfolio return, because the return never sees it.
Currencies are not converted. Balances are summed as reported. A EUR account and a USD account produce a total that is not money in any currency.
Cent accounts are the sharpest edge: a broker reporting USC is normalised to USD for the label, so the portfolio will not even flag itself as Mixed; it will simply report totals a hundred times too large. Keep one currency per portfolio, and keep cent accounts in their own.
The merge is lazy. When new data arrives for any account inside a portfolio, that portfolio is flagged for recalculation and rebuilt on the next load, while the aggregate balance and equity update immediately.
🧬 Correlation: When the Second Account Adds Nothing
Diversification requires that the accounts lose money at different times. If they lose together, you have not diversified: you have placed one bet in several places and paid several sets of costs to do it.
Automation makes correlation the default. Across the public accounts with trading history, the median autotrading share is 99%, and 53.9% of accounts are more than 90% automated. The same EA, the same parameters, the same symbols, the same session, on three accounts, is one strategy with three invoices.
Three ways to be correlated without noticing:
- Same EA, several accounts. Obvious once stated, invisible in a list of account cards.
- Different EAs, same market condition. Two gold breakout systems are one gold breakout system on the day gold gaps.
- Same broker. One price feed, one spread-widening policy, one stop-out engine. Even genuinely different strategies inherit the same execution shock.
The test costs two minutes: open the drawdown chart of each account and compare the dates of the troughs, not their depths. Troughs on the same dates mean one strategy. Troughs on different dates mean the second account is earning its keep.
📉 What Combining Really Does to Drawdown
Here is the part that usually gets oversold, so take the honest version. A combined drawdown, in percent, will not come out worse than your worst single account. That is arithmetic: the merged curve is a blend, and a blend cannot fall further in percentage terms than its deepest component. Where it lands underneath that ceiling is decided by correlation, and by almost nothing else.
- Uncorrelated accounts: the combined figure sits near the average or below. Diversification paid.
- Correlated accounts: it sits right next to your worst account. Diversification paid nothing, and in cash the loss is the sum of all of them.
The percentage is comforting; the money is not. That is the common self-deception here: watching a percentage behave while the dollar drawdown triples.
Two things only the merged curve can tell you. The deepest combined day is usually not the deepest day of any single account: it is the day several partial drawdowns overlapped, and reading accounts one at a time you never find that date. And time under water only exists on a curve that includes everything.
For context, across those public accounts the median deepest drawdown is 9.7%, 38.2% have been more than 20% underwater, and 17.6% more than 50%. If your combined number looks tame while one component sits in that last group, check why it is tame. A large idle account dilutes a drawdown percentage just as effectively as genuine offsetting does, and only one of the two is a risk control.
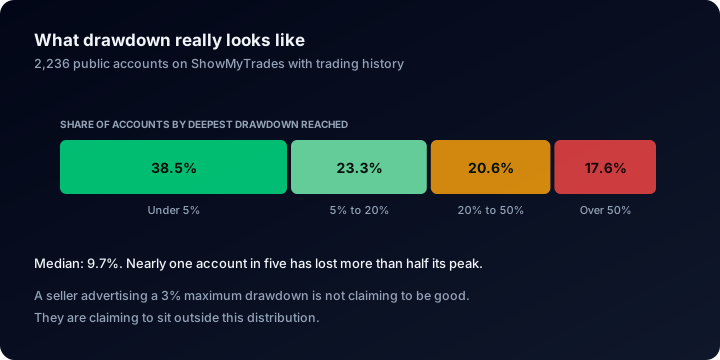
Find each of your accounts in these bands first, then ask what the combined figure is smoothing over.
🏦 Same Broker or Different Brokers
The 10,000+ connected accounts on ShowMyTrades sit across 703 distinct broker servers. Spreading is common (429 users hold accounts at more than one broker), but same-broker and multi-broker setups answer different questions.
| Same broker | Different brokers | |
|---|---|---|
| Comparing strategies | Clean. Execution, spreads and swap are shared, so a gap between accounts is a gap between strategies | Noisy. Part of the gap belongs to the broker, not to you |
| Comparing brokers | Impossible | The whole point: same strategy, two cost structures |
| Concentration risk | One counterparty, one feed, one stop-out engine, one withdrawal policy | Spread across counterparties |
| Portfolio header | Shows the broker name | Shows Mixed |
The practical rule: to compare two EAs, run them at the same broker; to compare two brokers, run the same EA at both.
Costs are not a rounding error at this scale. The public accounts on the platform have paid $4,782,670 in commissions and $862,547 in swap, and 86.3% of accounts with any swap activity pay net negative swap.
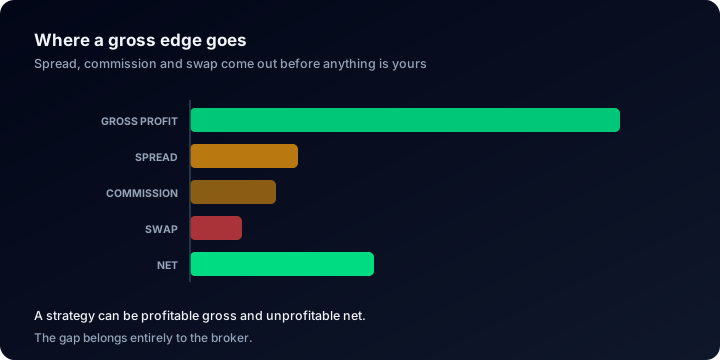
Each account you fund runs its own copy of this waterfall, with its own three deductions.
Every one of those lines is multiplied by the number of accounts you run. Price the spread and the swap before you fund a second account. The forex calculators guide covers the maths, and the calculators live under /tools.
🛠️ Building One in the Dashboard
The flow is short.
- Dashboard → Portfolios → New portfolio.
- Portfolio Details: a name, 2 to 80 characters. Name it after the question it answers ("Gold EAs, live" beats "Portfolio 2").
- Select Accounts: a checkbox list of every connected account with its platform badge and balance, plus Select all and Clear. Between 1 and 100 accounts per portfolio, up to 30 portfolios per user. MT4, MT5, cTrader and TradeLocker accounts can all sit in the same portfolio.
- Create Portfolio: you land on the portfolio page, which uses the same layout as an account page: KPI row, balance and equity chart, growth (TWR) and drawdown charts, monthly returns, advanced statistics, currency pair breakdown, trades table. Every figure is computed on the merged data.
- Settings: rename, chart colours, which sections are visible, and visibility: private, published, or unlisted (link-only, out of search).
- Published portfolios get a public URL whose slug is prefixed
ptf-, generated from the name. Unlike an account slug, it cannot be edited afterwards. Published portfolios also appear on your public trader profile alongside your individual accounts.
The one control a portfolio page has that a single account page does not: Custom Analysis gains an Accounts filter: a row of chips, one per account in the portfolio. Select two of your five and every statistic on the page recomputes for that subset.
It answers "what does this look like without the martingale account" in one click, and it stacks with the symbol, magic number and date filters, so the answer can be saved as a preset.
Portfolio access is unlocked through qualified referrals: three invited users who connect a real account and close at least 20 trades unlock a year of access, cumulatively. Users who unlocked it under the earlier rule keep it permanently. If access lapses, portfolios you already published stay online: no broken links, no dead widgets.
🧷 What a Portfolio Does Not Inherit
Skipping this list causes most of the questions we get.
- Track Record Verified is not displayed on portfolio pages. Verification is tied to an individual account and its read-only investor password. If you want that badge read, publish the accounts as well as the portfolio. See verified vs unverified track records.
- Trading Privileges Verified carries over only when every account in the portfolio is verified. One unverified account and the badge disappears from the whole thing.
- Terminal Info stays on the account pages. Ping, build, autotrading state and DLL permissions are per terminal; there is no aggregate view.
- The trades table does not label the source account. Use the Accounts filter in Custom Analysis to isolate one.
- The stored drawdown only ever gets worse. It records the deepest point ever reached and does not improve as you recover. That is deliberate.
- One demo account flags the whole portfolio as demo. If a demo account is in the mix, the portfolio is not evidence of live performance.
⚠️ Five Ways People Fool Themselves
- Including only the good accounts. A portfolio of your three winners is a curated screenshot with extra arithmetic. The blown account belongs in there too: it is the one that tells you what your process actually produces.
- Mixing currencies, or dropping a cent account in. Values are summed as reported. The totals become meaningless and nothing on the page warns you.
- Leaving a dead account in. If an account stops sending data, its last known equity is carried forward day after day: a flat line that dilutes the return and flatters the drawdown percentage. Reconnect it or take it out.
- Counting copies as strategies. Three accounts running one EA is one strategy at three times the size. Sizing it as though it were three independent bets is how a 10% drawdown becomes an account-closing event.
- Reading the combined number and never opening the components. The aggregate is for measuring; the individual pages are for diagnosing. The portfolio tells you something went wrong in March. Only the account pages tell you which strategy did it.
❓ FAQ
Does moving money between my own accounts distort the portfolio return? No. Gain is time-weighted and the drawdown peak is adjusted for deposits and withdrawals, so an internal transfer nets out. If both accounts sit inside the same portfolio the summed balance does not move either: the withdrawal on one cancels the deposit on the other.
Can I mix MT4, MT5, cTrader and TradeLocker in one portfolio? Yes. The merge works on closed trades and daily equity, which all four platforms provide. Keep the account currency consistent across them.
Why is my portfolio Gain lower than the average of my accounts' Gains? Because it is not an average. It is a single time-weighted return on one merged equity curve, so a large account dominates the result and a small account with a spectacular percentage barely registers. That is the correct answer to "what did my capital do".
Can I publish a portfolio without publishing the accounts inside it? Yes. Visibility is set per entity. Publishing a portfolio does not make its component accounts public.
How many accounts can I put in one portfolio? Between 1 and 100, and you can hold up to 30 portfolios. Several small, purposeful portfolios usually beat one that contains everything: one per strategy, or one per broker, so each answers a single question.
What happens if my portfolio access expires? You lose the dedicated area, but portfolios you already published stay online and keep serving their pages and widgets.
🔗 Related Guides
- How to read a trading account dashboard: every metric on the page, explained
- The complete guide to tracking trading performance: which numbers to monitor, and why
- Verified vs unverified track records: what makes performance data trustworthy
- How to verify your trading account: both badges, on every account you run
See what real multi-account trading looks like. Every page on Explore is broker-synced and public, drawdowns included.
Connect your accounts free and read them as one curve instead of four percentages.
How to Find Real Trading Accounts Worth Studying {YEAR}
Explore lists public accounts by recency, not by rank. Here is the method for choosing which ones deserve an hour of study, and the five numbers that decide it.
What Third-Party Verification Actually Proves (And What It Does Not) {YEAR}
Two badges answer two different questions: is the data real, and does the publisher own the account. Here is what each proves, and the four things neither can.