Custom Analysis: Slice Your Trade History Until It Tells the Truth 2026

🎯 The Account Average Is Not a Strategy
Your account page shows one profit factor, one win rate, one drawdown. Almost nobody trades one thing.
You run an EA on EURUSD and another on gold. You take manual trades on the side. You tested a martingale for three weeks in March and killed it. The dashboard adds all of that together and hands you a single number that describes none of it.
That number still matters: it is what a stranger evaluating your record works with, and it is the number the dashboard guide teaches you to read. But it cannot answer the question you actually have: which part of this account makes the money, and which part quietly gives it back?
Custom Analysis exists for that question. Pick a subset of your own trades and every statistic on the page recalculates as if only those trades had ever existed.
🎛️ Every Filter in the Panel
Custom Analysis opens as a single side panel. Nothing here writes to your history: you are describing a subset, not editing anything.
| Filter | What you set | What it isolates |
|---|---|---|
| Date Range | From / To dates | A season, a quarter, everything since a settings change |
| Accounts | Account toggles (portfolios only) | One account inside a multi-account portfolio |
| Symbols | Chips, built from the symbols this account traded | One instrument, or a group like the metals |
| Magic Numbers | Chips, with 0 shown as Manual (0) | One EA, or your discretionary trades only |
| Trade Type | Buy (Long), Sell (Short), Deposit, Withdrawal | Directional bias, or balance operations |
| Days of Week | Mon–Sun toggles | Monday gaps, Friday closes |
| Trading Hours (Server Time) | 24 hourly toggles, 00–23 | A session: London, New York, the overlap |
| Lot Size | Min / Max | Whether size scaling helped or hurt |
| Profit Range | Min / Max, account currency, net of commission and swap | Outliers, or everything except them |
| Trade Duration | Min / Max in seconds (close time minus open time) | Scalps against holds |
| Options | Include swaps in profit calculations | Gross strategy result vs. what the broker left you |
| Comment Filter | Include or Exclude, comma-separated keywords | Anything your EA writes into the comment field |
Three details that trip people up.
Hours are broker server time, not your local clock. Most MT4 and MT5 servers sit around GMT+2 or GMT+3, and the offset shifts with daylight saving. Check what your server uses before concluding that you trade badly at 09:00.
Days and hours read the open time. A position opened at 23:50 on Friday and closed on Monday counts once, as Friday hour 23, not across the days it stayed open.
Duration is in seconds. One hour is 3600. The median account on ShowMyTrades holds a trade for 2.4 hours (roughly 8600 seconds), so a "long holds only" filter on a typical account starts above that.
Leaving a section untouched means no filter at all: the chip and toggle blocks say so explicitly ("All symbols (no filter)"); the numeric ranges just stay empty.
🔬 The Method: Change One Thing, Compare Two Numbers
Filtering is easy. Filtering usefully is the same discipline as any experiment: hold everything constant, move one variable, write down what changed.
A working sequence:
- Baseline first. Note four numbers from the unfiltered account: profit factor, drawdown, trade count, expectancy. Everything after this gets compared against them.
- Split by source. One magic number at a time: the highest-value cut on almost every account, because it separates systems that have nothing to do with each other.
- Split by instrument. Inside the winning system, filter symbol by symbol. If one pair carries the result, you have one edge, not a strategy.
- Split by time. Hours and days. A system that only works in the London session is a real finding, and an actionable one: switch it off for the rest of the day.
- Split by size and duration. Lot and duration ranges tell you whether the result came from the trades you meant to take or the ones that got away.
- Then invert it. Filter to the losing subset and read it directly. Traders study winners for hours and never open the losers as a group.
The rule that keeps this honest: compare subsets, never read one in isolation. "EURUSD has a profit factor of 1.6" means nothing alone. "EURUSD is 1.6 while the rest of the account is 1.05, over comparable trade counts" is a finding.
💾 Presets: Save the Question, Not the Answer
Rebuilding a twelve-toggle filter every Monday is how analysis dies.
Set your filters, press Save, name it, done. The preset stores the filter combination, not the result, so it re-runs against your current history every time you load it. "London session, EA 4471, no swaps" answers a different question in November than it did in June, which is the point.
Presets are stored per account and per portfolio, up to 100 each, with three controls:
- Load: click the preset name and the filters drop into the panel. Nothing is calculated until you press Analyze, so you can load a preset and tweak it first.
- Overwrite (save icon): replace the stored filters with whatever is in the panel.
- Delete (trash icon): remove it.
Then two switches that decide when the preset runs on its own:
⭐ Default (star icon). The preset auto-applies on your own dashboard every time you open that account: if your working view is "exclude anything with test in the comment", make it the default and stop re-typing it. A Default badge marks it in the list, and the page loads with the analysis already active.
🌐 Public default (globe icon). The preset auto-applies for visitors on your public account page, and a green Public badge marks it. This is the one to think about before clicking: the next section is entirely about it.
Only one preset can be the default, and only one the public default; setting a new one clears the old.
🌍 What Visitors See, and What They Can Undo
Anyone reading your public account page also gets the Custom Analysis button. They can filter your record however they like (by symbol, by hour, by magic number, by comment keyword), but the panel opens without the preset list: visitors save nothing, see none of your saved presets, and change nothing about what you published.
If you have set a public default preset, their page loads with it already applied, under a banner reading Analysis preset applied by owner: "name" and the filter count. Next to it sits a Reset button that returns them to your complete, unfiltered record in one click.
So a public preset is a lens, not a mask. It is legitimate for framing ("this page shows the EA I actually sell, not the manual trades on the same account") and useless for hiding, because the reset is right there and the banner names what you did.
Use it when the account genuinely runs more than one thing, not to make a drawdown disappear. Anyone evaluating you seriously will press Reset in the first ten seconds. That is the method described in how to verify trading performance claims.
📏 Sample Size: Why Most Filtered Results Are Noise
Across the public accounts on ShowMyTrades with trading history, the median account has 171 closed trades: that is the whole history. Now slice it: one magic number out of three, one symbol out of five, London hours only, and 171 trades become 20. Every statistic recalculates on those 20 and presents them with the same confident formatting as the full record.
Twenty trades is an anecdote with decimal places.
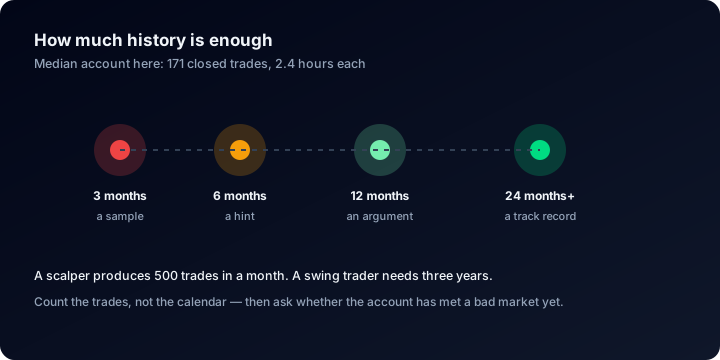
Every filter you add spends trades from a budget most accounts never had much of.
No threshold makes a subset trustworthy, but there is a useful ordering (rules of thumb, not measurements):
| Subset size | What it can support |
|---|---|
| Under 30 trades | Curiosity. Look at the trades individually instead |
| 30–100 trades | A hypothesis worth testing forward, nothing more |
| 100–300 trades | Direction. Profit factor and win rate start to mean something |
| 300+ trades | A comparison you can act on |
Two guardrails:
Check the trade count on every subset. It is the first number to read after applying a filter, before the profit factor and before the drawdown.
Treat subset drawdown as hypothetical. With Custom Analysis active, drawdown is recomputed on the filtered trades: it answers "what would the curve have looked like if only these had existed", which is not what happened. Your real drawdown is the unfiltered one, and it is what anyone comparing you to the field uses. Across public ShowMyTrades accounts the median deepest drawdown is 9.7%, and 38.2% have been more than 20% underwater.
🖱️ Doing It, Click by Click
On your own account, open Dashboard → your account and press Custom Analysis in the top bar (the slider icon). The panel opens on the right.
Set your filters, press Analyze. The panel closes and a banner appears at the top of the page: Custom Analysis active (N filters), with Edit and Reset buttons. Everything below recalculates: the KPI row, the equity and growth charts, the monthly returns table, the advanced statistics block, the Breakdown Statistics module (both the By Symbol and By Magic Number tabs), and the closed trades table, which now lists only your subset.
Two things worth doing first:
Name your magic numbers. Rename the rows in the By Magic Number tab of Breakdown Statistics and the alias appears in the Custom Analysis panel as Gold Scalper - 4471 instead of a bare integer. The untagged bucket keeps its Manual (0) label and cannot be renamed.
Decide about swaps early. Untick Include swaps in profit calculations and swap is zeroed wherever the page recalculates, leaving the strategy's raw result; tick it and you see what you actually keep. Across public ShowMyTrades accounts $862,547 has been paid in swap, and 86.3% of accounts with swap activity pay net negative swap. For overnight systems the gap between those two views is the whole question.
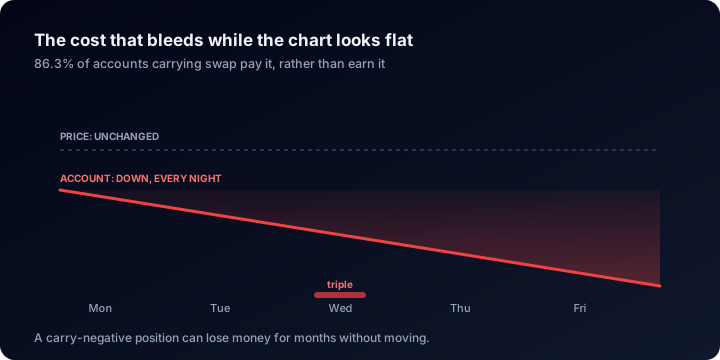
Unticking the swap toggle removes this cost from the page, not from the account.
Commissions, $4,782,670 across the same accounts, are never removed by this toggle: to model a different cost structure use the trading calculators, not this panel.
On a portfolio the panel gains one extra block, Accounts, isolating a single account inside the group. 699 ShowMyTrades users run more than one account and 429 run accounts at more than one broker: same strategy, two brokers, and this filter tells you which one is costing you.
⚠️ Five Ways Filtering Lies to You
- Slicing until it looks good. Try twelve filter combinations and one will look excellent by chance alone. That is not a discovery, it is a search. Decide what you are testing before you open the panel, and write down the answer you expect.
- Reading a 20-trade subset as a result. The median account has 171 trades in total, and most filters cut that by 80% or more. Check the trade count first, every time.
- Comparing subsets of wildly different sizes. A 400-trade subset and a 25-trade subset are not comparable, however far apart their profit factors look. Narrow the date range on the larger one until the counts are closer, then compare.
- Quoting a filtered drawdown as your drawdown. It is a hypothetical, and presenting it as your record is the behaviour that makes track records worthless. See verified vs unverified track records.
- Filtering out the losers and calling it a strategy. Setting Profit Range min to 0 gives you a beautiful curve of every trade that worked: useful as a diagnostic, meaningless as a claim. The same trap applies to excluding one "experimental" magic number after you already know how it did.
❓ FAQ
Do my filters change what other people see? No, unless you set a preset as the public default with the globe icon. Your own filtering is local to your session, and even a public default is reversible by any visitor.
Can I break my data with a bad filter? No. Custom Analysis never writes to your trade history: press Reset and the page returns to the full record.
Why did I get a rate limit message? Each analysis is a real recalculation on the server, so requests are capped per IP at 10 per minute, 100 per hour and 300 per day. Set every filter you want first, then press Analyze once, instead of applying them one at a time.
Do presets update themselves as new trades arrive? Yes. A preset stores the filter combination, not a snapshot, so loading it next month runs it against everything synced since.
My magic numbers all show as 0. Why?
Magic number 0 means the trade carried no EA identifier: manual trades, and some copy-trading and bridge setups. The panel labels it Manual (0). If your EA writes to the comment field instead, use the Comment Filter: it matches any part of the comment, case-insensitively, so scalp catches EA_scalp_v2.
Is Custom Analysis available on portfolios? Yes, with an extra Accounts block for isolating one account inside the group. Presets are saved per portfolio, separately from those on the individual accounts.
🔗 Related Guides
- How to read a trading account dashboard: every metric on the page, and what normal looks like
- The complete guide to tracking your trading performance: which numbers to monitor over time
- How to verify trading performance claims: the checklist to run on someone else's record
- How to verify your trading account: the badges that make your analysis worth reading
Try it on a record that is not yours. Every account on Explore is broker-synced and public, and the Custom Analysis button works on all of them: pick one, isolate its biggest symbol, and watch the profit factor move.
Then connect your own account free and run the same cut on your history.
Volume Analysis: What Your Lot Sizes Say About Your Risk {YEAR}
Lot size is the one number you choose before the market decides anything. Read it as a risk fingerprint: martingale signatures, fixed-lot drift, sizing done right.
Embed Your Verified Results Anywhere: The Widget Guide {YEAR}
Seven interactive widgets, eleven auto-updating images, one paste of HTML: how to put a broker-verified track record on your own site, forum or sales page.