What Is Cost Percentage in Trading?
Cost percentage is the share of an account's gross trading result consumed by commission and swap, expressed as a percentage. It answers the question a raw cost total cannot: not how much you paid, but how much of what the strategy produced you were allowed to keep. Two accounts can pay identical commissions and be in completely different businesses.
How it works
Costs are already deducted from every profit figure shown on an account page, so the ratio starts by adding them back to reconstruct what the strategy generated.
Gross result = Net result + Commissions paid + Swap paid
Cost %       = (Commissions paid + Swap paid) / Gross result x 100
Enter both cost figures as positive amounts: you are undoing a deduction, not applying one. Swap runs either way: an account that is a net receiver holds a credit, not a cost, and it does not belong in the numerator.
Worked quickly: an account showing $4,900 of commissions, $700 of swap paid and a net result of +$2,100 produced a gross result of $7,700, of which $5,600 went to the broker. That is 72.7%; the trader kept the other $2,100.
The same totals, divided by lots and by trade count, say why. A ratio driven by the rate per lot is a broker problem; one driven by the number of times that rate was paid is a strategy problem, and only the first is fixed by moving accounts.
One cost cannot be added back: the spread. It is paid inside the entry and exit prices, so it appears as a line item nowhere, not in MetaTrader, not here. Every cost percentage computed from published figures is therefore a floor, and the gap widens the shorter the average trade.
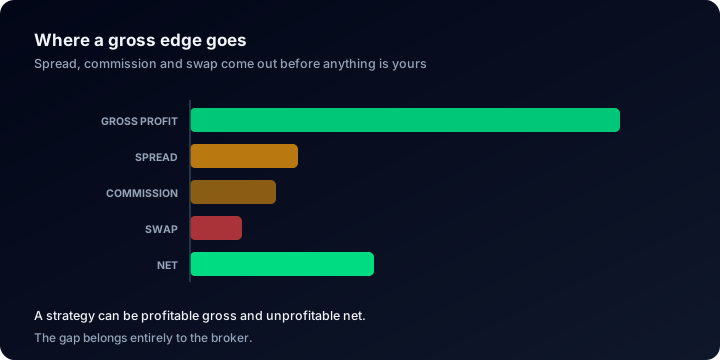
Two of the three can be added back from the page. The spread never appears as a line at all.
Why it matters
The median profit factor across public accounts on ShowMyTrades is 1.28, and that figure is already net of costs: commission and swap are folded into each trade before any statistic is computed. Twenty-eight cents of winnings per dollar of losses is the entire margin of survival for the typical published account.
At that thickness, cost percentage decides which side of 1.0 an account lands on. A strategy that is gross-profitable and net-flat looks healthy from outside: green curve, more green months than red, profit factor above 1.0. Nothing on the page is broken. The edge simply has a silent partner taking most of it.
What the data shows
Accounts published on ShowMyTrades have paid $4,782,670 in commissions and $862,547 in swap, over 1,724,575 lots. These figures describe accounts published here, not traders in general.
Swap is not symmetric. Of the accounts carrying any swap at all, 86.3% pay net negative swap. Holding overnight is a cost for close to nine accounts in ten; the minority who collect it are usually doing so deliberately.
Set that against the trading pattern: a median of 171 closed trades per account, with a median trade length of 2.4 hours. A population trading that frequently pays the cost line often, and the shorter the hold, the larger the share of gross result that never reaches the balance.
Where you see it on ShowMyTrades
There is no Cost % figure on the page, and none is computed behind it either: no field, no tile, no stored value. What the page publishes are the inputs, and the ratio is a two-minute calculation on them.
The Advanced Statistics module, Trades column, carries Total Commissions, Total Swap Paid, Total Lots and Total Trades. Total Swap Paid is coloured (red for a net payer, green for a net receiver), so its direction is readable without checking the sign. The net result to divide by is Profit, in the Account Stats panel beside the charts.
Per-trade detail sits in the Trade History & Balance Progression table. Net P/L is always shown; Profit (Gross), Swap and Commission are separate columns that are hidden by default and switched on from the Display menu. Breakdown Statistics splits the record By Symbol and By Magic Number, but its columns are Trades, Pips and Profit, net of costs, with no cost line of its own, so it localises where the volume and the result concentrate rather than the spend itself.
Two caveats. An owner can hide any of these modules from their public page, so an account showing no cost block is not an account without costs. And the per-lot cost benchmark our backend computes is shown to the account owner in their own dashboard only, never on a public page.
Common misunderstandings
- "My commissions are low, so costs are not my problem." Low against what? Four thousand dollars is a rounding error on eighty thousand of gross result and fatal on forty-two hundred. The absolute figure means nothing alone.
- "Above 100% is impossible." It is common. It means the strategy produced a gross profit and the account still finished negative.
- "The spread is included." It is not, anywhere. Treat any computed ratio as a floor.
- "Swap only matters to long-term traders." It accrues on any position held past the broker's rollover, including one opened in the afternoon and closed the next morning.
The full method, with the diagnosis for each range of the ratio: trading cost percentage explained.
Related terms
Profit Factor
Profit factor is gross profit divided by gross loss. Below 1.0 an account loses by construction. Here are the bands and the 1.28 median across thousands of accounts.
Spread
A spread is the gap between the bid and ask price, the cost you pay to enter a trade. Here is how it works, what it costs per lot, and why brokers differ.
Swap
A swap is the interest charged or paid for holding a forex position overnight. How it is calculated, why Wednesday is triple, and what thousands of accounts pay.
Track Record
A track record is the documented history of a trading account. What it must contain, how long it has to run to carry evidence, and what real accounts show.