What Is Profit Factor? Formula, Good Values, Real Data
Profit factor is gross profit divided by gross loss: the total won across all winning trades, divided by the total lost across all losing trades. A profit factor of 1.50 means the account made $1.50 for every $1.00 it gave back. Below 1.00 the account loses money by construction, regardless of how often it wins.
How it works
Profit Factor = Gross Profit / |Gross Loss|
Note what the formula ignores: how long the account traded, how much capital it used, and how deep it fell along the way.
It can also be written in terms of win rate and average trade size, which is where it becomes diagnostic:
Profit Factor = (Win Rate × Avg Win) / ((1 − Win Rate) × Avg Loss)
Two very different systems can land on the same value. A 30% win rate with winners four times the size of losers gives 1.71. An 80% win rate with winners half the size of losers gives 2.00. Both work; they fail differently and feel completely different to trade.
| Profit factor | Reading |
|---|---|
| Below 1.00 | Loses money: structurally, not marginally |
| 1.00 – 1.10 | Inside the noise. One bad week erases it |
| 1.10 – 1.30 | Thin but real edge, if the sample is large |
| 1.30 – 2.00 | A working strategy |
| 2.00 – 3.00 | Strong. Check trade count and cost accounting |
| Above 3.00 | Rare on long histories: usually a short sample, a few outsized winners, or open losers not yet realised |
Why it matters
Profit factor is the cleanest single answer to "does this system make money", and it is much harder to dress up than a win rate, because every loss enters the denominator at full size.
It is not, however, a risk measure. Profit factor knows nothing about sequence: an account that made its money in one month and bled for eleven shows the same value as one that ground upward every week. Read it next to maximum drawdown, or you are measuring the destination without the trip.
The same caution applies to a profit factor quoted from a backtest: optimisers maximise exactly this ratio, so a high backtested value often measures the fitting process rather than the strategy.
What the data shows
The figures below describe accounts published on ShowMyTrades, not traders in general. Across the published accounts that have trading history (August 2026), the median profit factor is 1.28 and the median win rate is 68.8%. Both are calculated after costs here: swap and commission are folded into each trade before it is classed as a winner or a loser, so 1.28 is net, not gross.
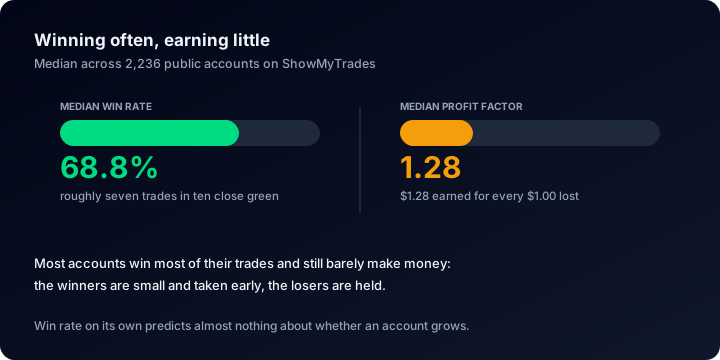
Two medians from the same set: the win rate looks strong, the edge behind it is thin.
That pairing is the point. Nearly seven trades in ten close green on the median account, and the whole edge still amounts to $1.28 earned for every $1.00 lost. Take an account sitting on both medians and invert the formula: its average winner is worth roughly 0.58× its average loser. Winning often and earning well are separate achievements, and the first is far easier to manufacture: hold losers, cut winners, and the win rate climbs while the profit factor falls.
The median Sharpe ratio on the same set is 0.05, and the median account has 171 closed trades. At that sample size a profit factor above 3.00 is not evidence of a superior system; it is evidence that the sample is too small to have met its worst trade yet.
Where you see it on ShowMyTrades
Profit Factor sits in the Advanced Statistics module on every published account page, alongside the numbers that explain it: Win Rate, Avg. Win, Avg. Loss, Expectancy, Total Trades and Sharpe Ratio. The six together say what the single ratio cannot.
Two product details matter. First, the costs already inside the ratio are itemised separately: the trades table carries Profit (Gross) with Swap and Commission as their own columns, and Advanced Statistics totals Total Commissions and Total Swap Paid, so you can see how much the net figure absorbed. Across published accounts those totals stand at $4,782,670 in commissions and $862,547 in swap. Second, Custom Analysis recomputes the whole statistics block on a filtered subset (by date range, symbol, magic number, direction or lot size), which is how you check whether a profit factor holds up outside its best quarter or without its best symbol.
Common misunderstandings
- "Profit factor above 1 means I am profitable." Only if costs are inside the ratio. Where they are not, a high-frequency system at 1.05 gross can be flat or negative once commission and swap are applied.
- "A high profit factor means low risk." It says nothing about drawdown, position size or sequence. A martingale position-sizing progression can post 4.00 right up to the day it does not.
- "It is comparable across timeframes." It is not annualised. A scalper's 1.20 over 20,000 trades and a swing trader's 1.20 over 60 are not the same statement.
- "Open trades do not affect it." They do, by absence. Floating losses left open are excluded from gross loss entirely, which inflates the ratio until the position is closed.
For which metrics to track over time and in what order, see the guide to tracking trading performance.
Related terms
Backtesting
Backtesting simulates a trading strategy on historical price data. What it can prove, what it cannot, and why live broker-synced results almost always differ.
Drawdown
Drawdown is the peak-to-trough fall in an account's value, in percent. Here is the formula, why it is cumulative, and what thousands of real trading accounts show.
Maximum Drawdown
Maximum drawdown is the deepest peak-to-trough fall an account ever recorded. The formula, the recovery table, and the real spread across thousands of accounts.
Position Sizing
Position sizing turns a risk percentage into a lot size using your stop distance and pip value. The formula, the three common methods, and what bad sizing costs.